Guyanese vs U.S. Virgin Islander In Labor Force | Age > 16
COMPARE
Guyanese
U.S. Virgin Islander
In Labor Force | Age > 16
In Labor Force | Age > 16 Comparison
Guyanese
U.S. Virgin Islanders
64.1%
IN LABOR FORCE | AGE > 16
0.4/ 100
METRIC RATING
270th/ 347
METRIC RANK
64.7%
IN LABOR FORCE | AGE > 16
11.3/ 100
METRIC RATING
217th/ 347
METRIC RANK
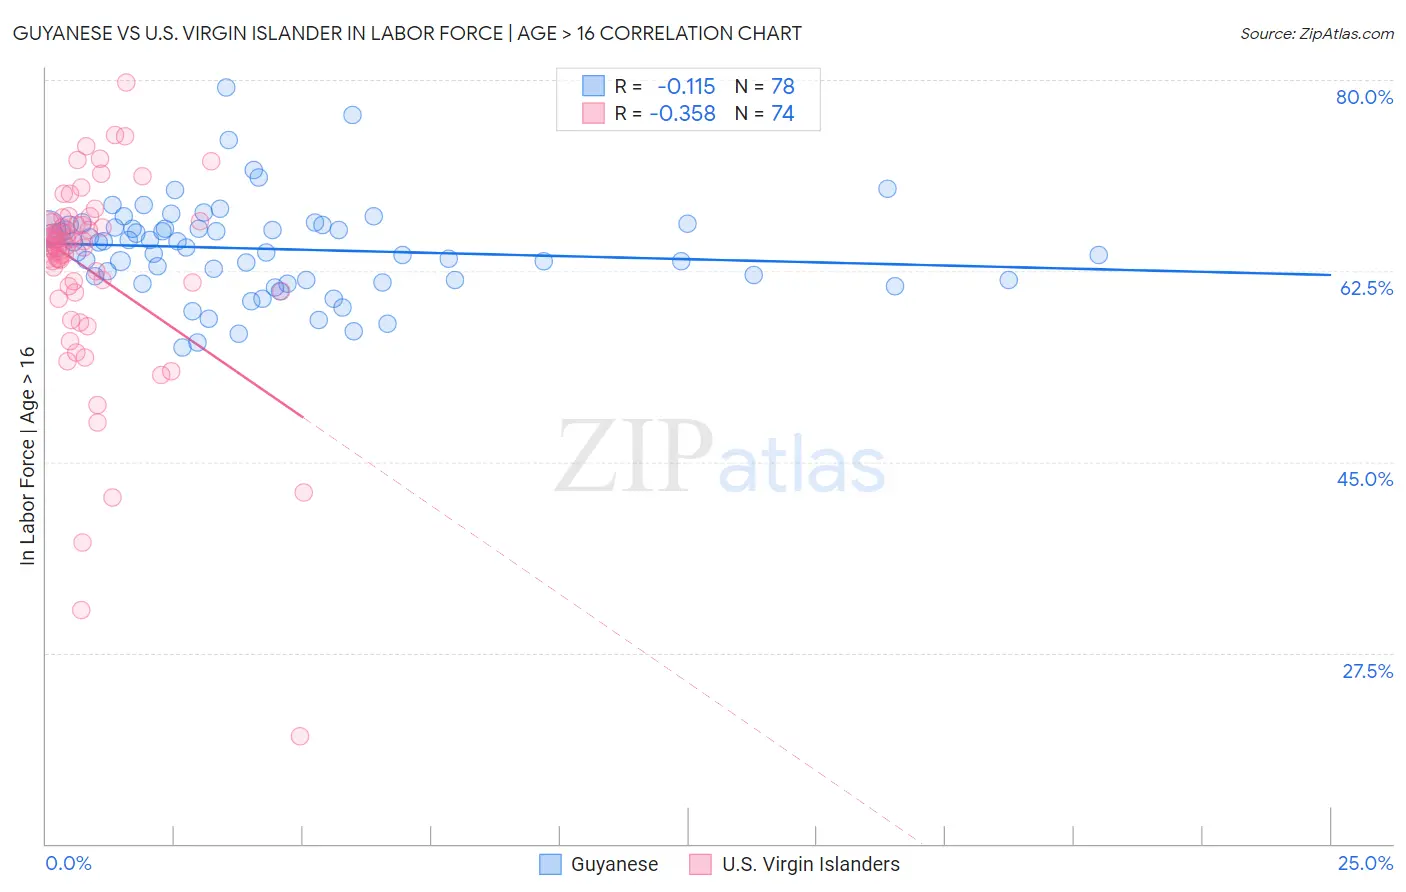
Guyanese vs U.S. Virgin Islander In Labor Force | Age > 16 Correlation Chart
The statistical analysis conducted on geographies consisting of 176,935,808 people shows a poor negative correlation between the proportion of Guyanese and labor force participation rate among population ages 16 and over in the United States with a correlation coefficient (R) of -0.115 and weighted average of 64.1%. Similarly, the statistical analysis conducted on geographies consisting of 87,527,161 people shows a mild negative correlation between the proportion of U.S. Virgin Islanders and labor force participation rate among population ages 16 and over in the United States with a correlation coefficient (R) of -0.358 and weighted average of 64.7%, a difference of 1.0%.
In Labor Force | Age > 16 Correlation Summary
| Measurement | Guyanese | U.S. Virgin Islander |
| Minimum | 55.5% | 19.9% |
| Maximum | 79.3% | 79.8% |
| Range | 23.8% | 59.9% |
| Mean | 64.5% | 62.4% |
| Median | 64.9% | 64.8% |
| Interquartile 25% (IQ1) | 61.7% | 60.6% |
| Interquartile 75% (IQ3) | 66.5% | 66.8% |
| Interquartile Range (IQR) | 4.8% | 6.2% |
| Standard Deviation (Sample) | 4.3% | 9.7% |
| Standard Deviation (Population) | 4.3% | 9.6% |
Similar Demographics by In Labor Force | Age > 16
Demographics Similar to Guyanese by In Labor Force | Age > 16
In terms of in labor force | age > 16, the demographic groups most similar to Guyanese are Dominican (64.1%, a difference of 0.0%), Irish (64.1%, a difference of 0.030%), Native Hawaiian (64.1%, a difference of 0.030%), Hmong (64.1%, a difference of 0.030%), and Immigrants from Cuba (64.1%, a difference of 0.050%).
| Demographics | Rating | Rank | In Labor Force | Age > 16 |
| Bahamians | 0.6 /100 | #263 | Tragic 64.2% |
| Dutch | 0.6 /100 | #264 | Tragic 64.2% |
| Cubans | 0.5 /100 | #265 | Tragic 64.2% |
| Immigrants | England | 0.5 /100 | #266 | Tragic 64.2% |
| Canadians | 0.5 /100 | #267 | Tragic 64.1% |
| Spaniards | 0.5 /100 | #268 | Tragic 64.1% |
| Irish | 0.4 /100 | #269 | Tragic 64.1% |
| Guyanese | 0.4 /100 | #270 | Tragic 64.1% |
| Dominicans | 0.4 /100 | #271 | Tragic 64.1% |
| Native Hawaiians | 0.3 /100 | #272 | Tragic 64.1% |
| Hmong | 0.3 /100 | #273 | Tragic 64.1% |
| Immigrants | Cuba | 0.3 /100 | #274 | Tragic 64.1% |
| Mexicans | 0.3 /100 | #275 | Tragic 64.1% |
| French American Indians | 0.3 /100 | #276 | Tragic 64.1% |
| Immigrants | Bahamas | 0.3 /100 | #277 | Tragic 64.0% |
Demographics Similar to U.S. Virgin Islanders by In Labor Force | Age > 16
In terms of in labor force | age > 16, the demographic groups most similar to U.S. Virgin Islanders are Belgian (64.7%, a difference of 0.0%), Alsatian (64.7%, a difference of 0.020%), Immigrants from Central America (64.7%, a difference of 0.020%), Immigrants from Czechoslovakia (64.8%, a difference of 0.030%), and Alaska Native (64.7%, a difference of 0.040%).
| Demographics | Rating | Rank | In Labor Force | Age > 16 |
| Immigrants | Denmark | 14.7 /100 | #210 | Poor 64.8% |
| Fijians | 14.1 /100 | #211 | Poor 64.8% |
| Alaskan Athabascans | 13.9 /100 | #212 | Poor 64.8% |
| Maltese | 13.8 /100 | #213 | Poor 64.8% |
| Estonians | 13.1 /100 | #214 | Poor 64.8% |
| Immigrants | Czechoslovakia | 12.3 /100 | #215 | Poor 64.8% |
| Belgians | 11.4 /100 | #216 | Poor 64.7% |
| U.S. Virgin Islanders | 11.3 /100 | #217 | Poor 64.7% |
| Alsatians | 10.7 /100 | #218 | Poor 64.7% |
| Immigrants | Central America | 10.5 /100 | #219 | Poor 64.7% |
| Alaska Natives | 9.9 /100 | #220 | Tragic 64.7% |
| Immigrants | Micronesia | 9.6 /100 | #221 | Tragic 64.7% |
| Hawaiians | 9.3 /100 | #222 | Tragic 64.7% |
| Immigrants | Belize | 9.2 /100 | #223 | Tragic 64.7% |
| Immigrants | Jamaica | 8.8 /100 | #224 | Tragic 64.7% |