Barbadian vs Danish Disability Age 5 to 17
COMPARE
Barbadian
Danish
Disability Age 5 to 17
Disability Age 5 to 17 Comparison
Barbadians
Danes
5.9%
DISABILITY AGE 5 TO 17
1.3/ 100
METRIC RATING
254th/ 347
METRIC RANK
5.7%
DISABILITY AGE 5 TO 17
26.5/ 100
METRIC RATING
191st/ 347
METRIC RANK
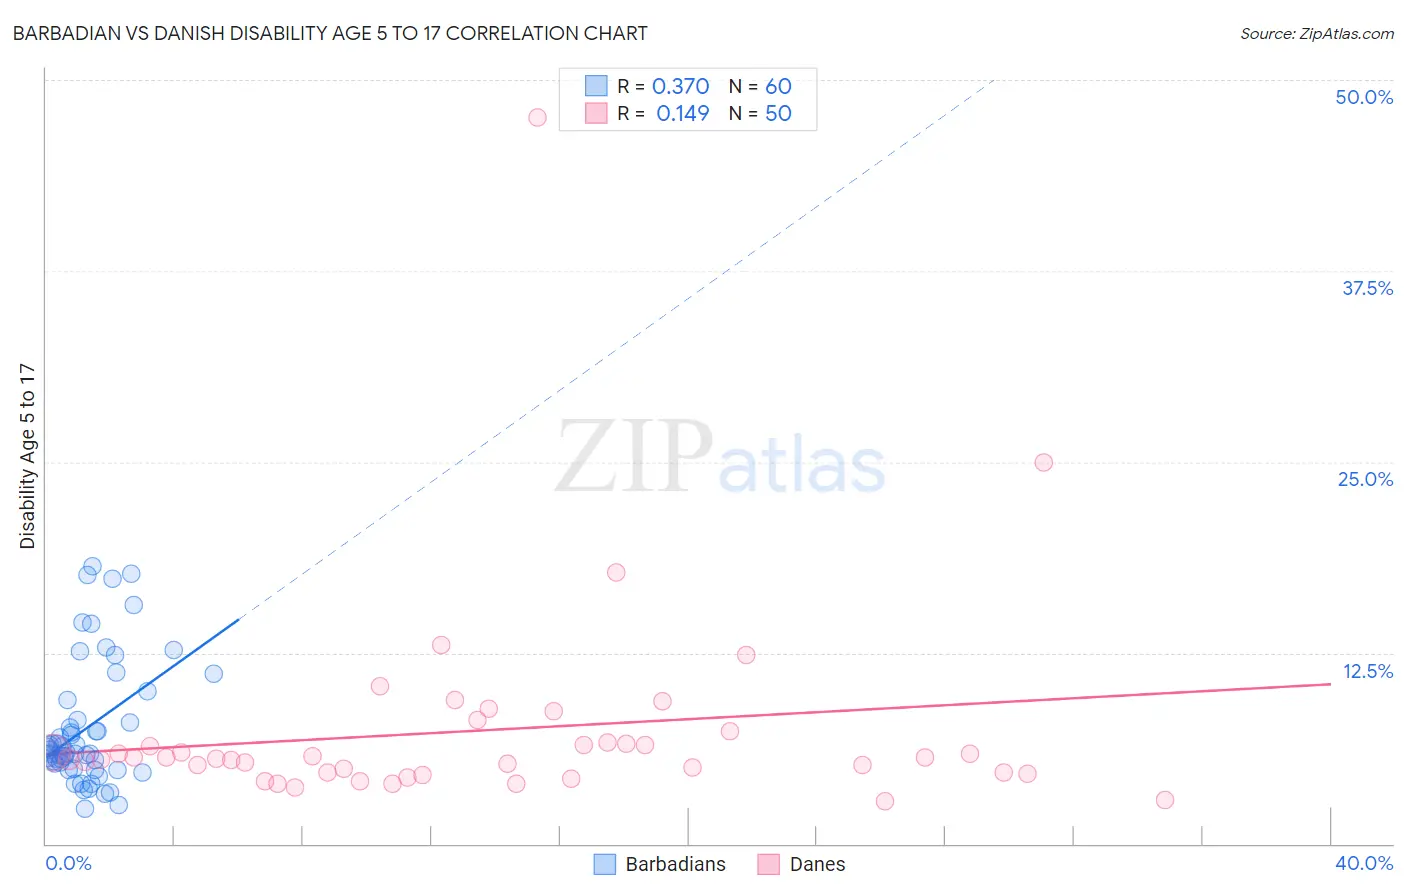
Barbadian vs Danish Disability Age 5 to 17 Correlation Chart
The statistical analysis conducted on geographies consisting of 140,971,871 people shows a mild positive correlation between the proportion of Barbadians and percentage of population with a disability between the ages 5 and 17 in the United States with a correlation coefficient (R) of 0.370 and weighted average of 5.9%. Similarly, the statistical analysis conducted on geographies consisting of 467,230,380 people shows a poor positive correlation between the proportion of Danes and percentage of population with a disability between the ages 5 and 17 in the United States with a correlation coefficient (R) of 0.149 and weighted average of 5.7%, a difference of 4.1%.
Disability Age 5 to 17 Correlation Summary
| Measurement | Barbadian | Danish |
| Minimum | 2.3% | 2.8% |
| Maximum | 18.2% | 47.6% |
| Range | 15.9% | 44.8% |
| Mean | 7.6% | 7.4% |
| Median | 6.1% | 5.6% |
| Interquartile 25% (IQ1) | 5.1% | 4.7% |
| Interquartile 75% (IQ3) | 8.8% | 6.6% |
| Interquartile Range (IQR) | 3.7% | 1.9% |
| Standard Deviation (Sample) | 4.1% | 6.9% |
| Standard Deviation (Population) | 4.0% | 6.9% |
Similar Demographics by Disability Age 5 to 17
Demographics Similar to Barbadians by Disability Age 5 to 17
In terms of disability age 5 to 17, the demographic groups most similar to Barbadians are Italian (5.9%, a difference of 0.070%), Scandinavian (5.9%, a difference of 0.10%), Honduran (5.9%, a difference of 0.17%), Immigrants from Cambodia (5.9%, a difference of 0.19%), and Polish (5.9%, a difference of 0.22%).
| Demographics | Rating | Rank | Disability Age 5 to 17 |
| Immigrants | Honduras | 1.8 /100 | #247 | Tragic 5.9% |
| British | 1.7 /100 | #248 | Tragic 5.9% |
| Immigrants | Ghana | 1.7 /100 | #249 | Tragic 5.9% |
| Poles | 1.5 /100 | #250 | Tragic 5.9% |
| Immigrants | Cambodia | 1.5 /100 | #251 | Tragic 5.9% |
| Hondurans | 1.5 /100 | #252 | Tragic 5.9% |
| Scandinavians | 1.4 /100 | #253 | Tragic 5.9% |
| Barbadians | 1.3 /100 | #254 | Tragic 5.9% |
| Italians | 1.2 /100 | #255 | Tragic 5.9% |
| Hopi | 1.0 /100 | #256 | Tragic 5.9% |
| Hispanics or Latinos | 1.0 /100 | #257 | Tragic 5.9% |
| Brazilians | 0.9 /100 | #258 | Tragic 5.9% |
| Slavs | 0.9 /100 | #259 | Tragic 5.9% |
| Somalis | 0.8 /100 | #260 | Tragic 5.9% |
| Immigrants | Middle Africa | 0.7 /100 | #261 | Tragic 5.9% |
Demographics Similar to Danes by Disability Age 5 to 17
In terms of disability age 5 to 17, the demographic groups most similar to Danes are Immigrants from Bosnia and Herzegovina (5.7%, a difference of 0.010%), Immigrants from Canada (5.7%, a difference of 0.030%), Immigrants from Eastern Africa (5.7%, a difference of 0.050%), Pueblo (5.7%, a difference of 0.060%), and Marshallese (5.7%, a difference of 0.10%).
| Demographics | Rating | Rank | Disability Age 5 to 17 |
| Syrians | 33.8 /100 | #184 | Fair 5.6% |
| Immigrants | Mexico | 33.7 /100 | #185 | Fair 5.6% |
| Fijians | 31.7 /100 | #186 | Fair 5.7% |
| Immigrants | Thailand | 30.2 /100 | #187 | Fair 5.7% |
| Marshallese | 28.1 /100 | #188 | Fair 5.7% |
| Pueblo | 27.5 /100 | #189 | Fair 5.7% |
| Immigrants | Eastern Africa | 27.3 /100 | #190 | Fair 5.7% |
| Danes | 26.5 /100 | #191 | Fair 5.7% |
| Immigrants | Bosnia and Herzegovina | 26.3 /100 | #192 | Fair 5.7% |
| Immigrants | Canada | 26.1 /100 | #193 | Fair 5.7% |
| Croatians | 23.6 /100 | #194 | Fair 5.7% |
| Immigrants | Nigeria | 23.4 /100 | #195 | Fair 5.7% |
| Inupiat | 23.3 /100 | #196 | Fair 5.7% |
| Immigrants | North America | 23.1 /100 | #197 | Fair 5.7% |
| Norwegians | 20.9 /100 | #198 | Fair 5.7% |