Immigrants from Switzerland vs Peruvian Disability Age 18 to 34
COMPARE
Immigrants from Switzerland
Peruvian
Disability Age 18 to 34
Disability Age 18 to 34 Comparison
Immigrants from Switzerland
Peruvians
6.3%
DISABILITY AGE 18 TO 34
92.5/ 100
METRIC RATING
126th/ 347
METRIC RANK
6.0%
DISABILITY AGE 18 TO 34
99.6/ 100
METRIC RATING
62nd/ 347
METRIC RANK
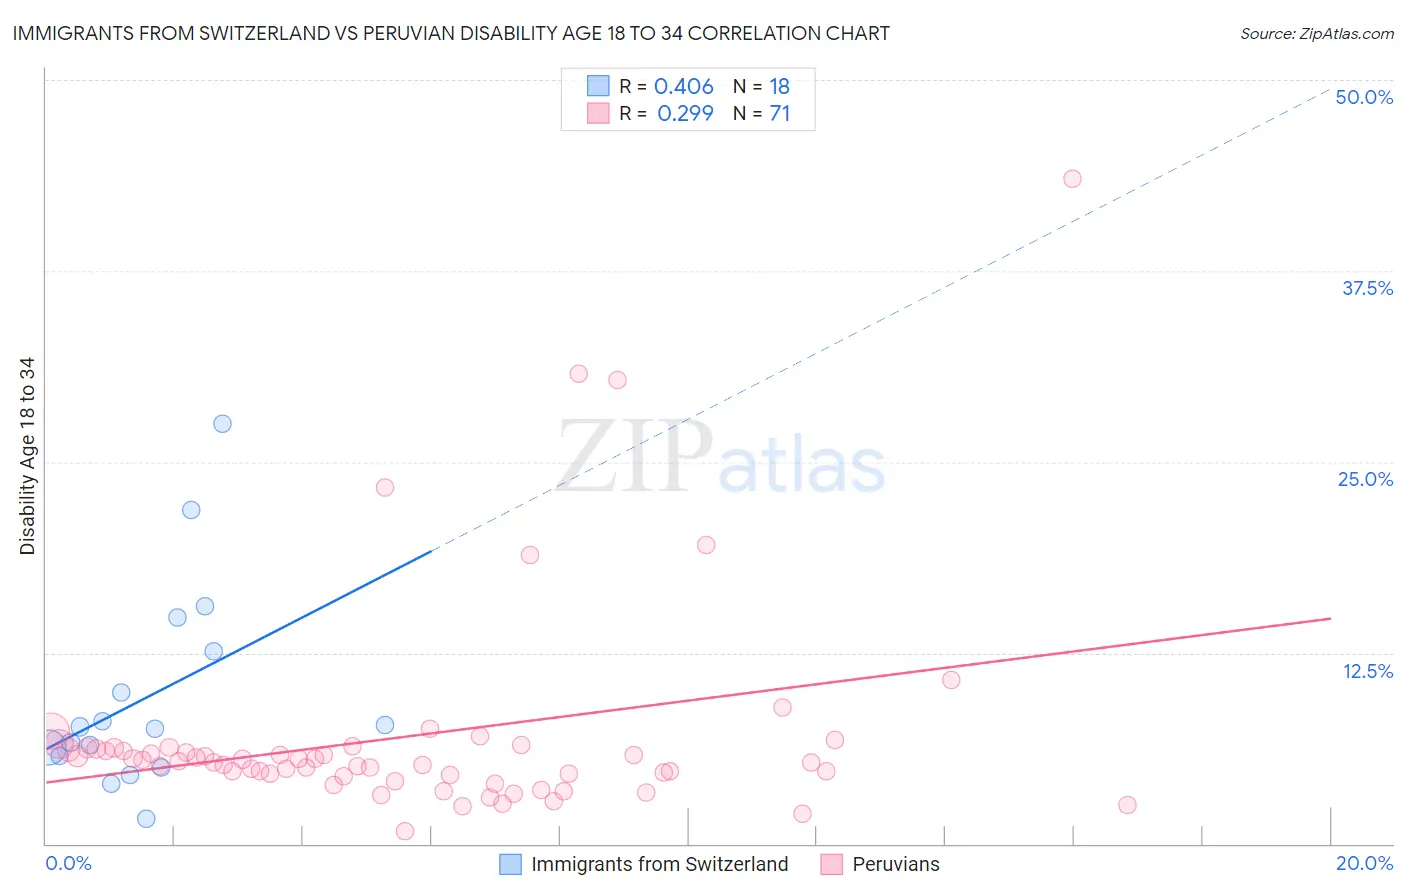
Immigrants from Switzerland vs Peruvian Disability Age 18 to 34 Correlation Chart
The statistical analysis conducted on geographies consisting of 147,932,555 people shows a moderate positive correlation between the proportion of Immigrants from Switzerland and percentage of population with a disability between the ages 18 and 35 in the United States with a correlation coefficient (R) of 0.406 and weighted average of 6.3%. Similarly, the statistical analysis conducted on geographies consisting of 362,638,552 people shows a weak positive correlation between the proportion of Peruvians and percentage of population with a disability between the ages 18 and 35 in the United States with a correlation coefficient (R) of 0.299 and weighted average of 6.0%, a difference of 5.7%.
Disability Age 18 to 34 Correlation Summary
| Measurement | Immigrants from Switzerland | Peruvian |
| Minimum | 1.7% | 0.85% |
| Maximum | 27.5% | 43.5% |
| Range | 25.9% | 42.7% |
| Mean | 9.6% | 7.0% |
| Median | 7.6% | 5.4% |
| Interquartile 25% (IQ1) | 5.8% | 4.5% |
| Interquartile 75% (IQ3) | 12.6% | 6.3% |
| Interquartile Range (IQR) | 6.8% | 1.8% |
| Standard Deviation (Sample) | 6.6% | 7.0% |
| Standard Deviation (Population) | 6.4% | 6.9% |
Similar Demographics by Disability Age 18 to 34
Demographics Similar to Immigrants from Switzerland by Disability Age 18 to 34
In terms of disability age 18 to 34, the demographic groups most similar to Immigrants from Switzerland are Macedonian (6.3%, a difference of 0.030%), Immigrants from Morocco (6.3%, a difference of 0.10%), Costa Rican (6.3%, a difference of 0.11%), West Indian (6.3%, a difference of 0.14%), and Chinese (6.3%, a difference of 0.15%).
| Demographics | Rating | Rank | Disability Age 18 to 34 |
| Chileans | 93.5 /100 | #119 | Exceptional 6.3% |
| Immigrants | Ukraine | 93.4 /100 | #120 | Exceptional 6.3% |
| Immigrants | Guatemala | 93.4 /100 | #121 | Exceptional 6.3% |
| Immigrants | Czechoslovakia | 93.3 /100 | #122 | Exceptional 6.3% |
| Costa Ricans | 92.9 /100 | #123 | Exceptional 6.3% |
| Immigrants | Morocco | 92.9 /100 | #124 | Exceptional 6.3% |
| Macedonians | 92.6 /100 | #125 | Exceptional 6.3% |
| Immigrants | Switzerland | 92.5 /100 | #126 | Exceptional 6.3% |
| West Indians | 92.0 /100 | #127 | Exceptional 6.3% |
| Chinese | 91.9 /100 | #128 | Exceptional 6.3% |
| Immigrants | Italy | 90.5 /100 | #129 | Exceptional 6.3% |
| Immigrants | Dominica | 90.5 /100 | #130 | Exceptional 6.3% |
| Immigrants | Saudi Arabia | 90.4 /100 | #131 | Exceptional 6.3% |
| Guatemalans | 89.6 /100 | #132 | Excellent 6.4% |
| Brazilians | 89.0 /100 | #133 | Excellent 6.4% |
Demographics Similar to Peruvians by Disability Age 18 to 34
In terms of disability age 18 to 34, the demographic groups most similar to Peruvians are British West Indian (6.0%, a difference of 0.030%), Salvadoran (6.0%, a difference of 0.050%), Taiwanese (6.0%, a difference of 0.070%), Trinidadian and Tobagonian (6.0%, a difference of 0.21%), and Immigrants from Sri Lanka (6.0%, a difference of 0.28%).
| Demographics | Rating | Rank | Disability Age 18 to 34 |
| Immigrants | Spain | 99.7 /100 | #55 | Exceptional 5.9% |
| Paraguayans | 99.7 /100 | #56 | Exceptional 5.9% |
| Immigrants | Haiti | 99.7 /100 | #57 | Exceptional 5.9% |
| Immigrants | Serbia | 99.7 /100 | #58 | Exceptional 5.9% |
| Immigrants | Caribbean | 99.6 /100 | #59 | Exceptional 6.0% |
| Immigrants | Sri Lanka | 99.6 /100 | #60 | Exceptional 6.0% |
| British West Indians | 99.6 /100 | #61 | Exceptional 6.0% |
| Peruvians | 99.6 /100 | #62 | Exceptional 6.0% |
| Salvadorans | 99.6 /100 | #63 | Exceptional 6.0% |
| Taiwanese | 99.6 /100 | #64 | Exceptional 6.0% |
| Trinidadians and Tobagonians | 99.5 /100 | #65 | Exceptional 6.0% |
| Burmese | 99.5 /100 | #66 | Exceptional 6.0% |
| Immigrants | North Macedonia | 99.5 /100 | #67 | Exceptional 6.0% |
| Immigrants | Poland | 99.5 /100 | #68 | Exceptional 6.0% |
| Immigrants | West Indies | 99.4 /100 | #69 | Exceptional 6.0% |