British vs Peruvian Disability Age 18 to 34
COMPARE
British
Peruvian
Disability Age 18 to 34
Disability Age 18 to 34 Comparison
British
Peruvians
7.3%
DISABILITY AGE 18 TO 34
0.2/ 100
METRIC RATING
263rd/ 347
METRIC RANK
6.0%
DISABILITY AGE 18 TO 34
99.6/ 100
METRIC RATING
62nd/ 347
METRIC RANK
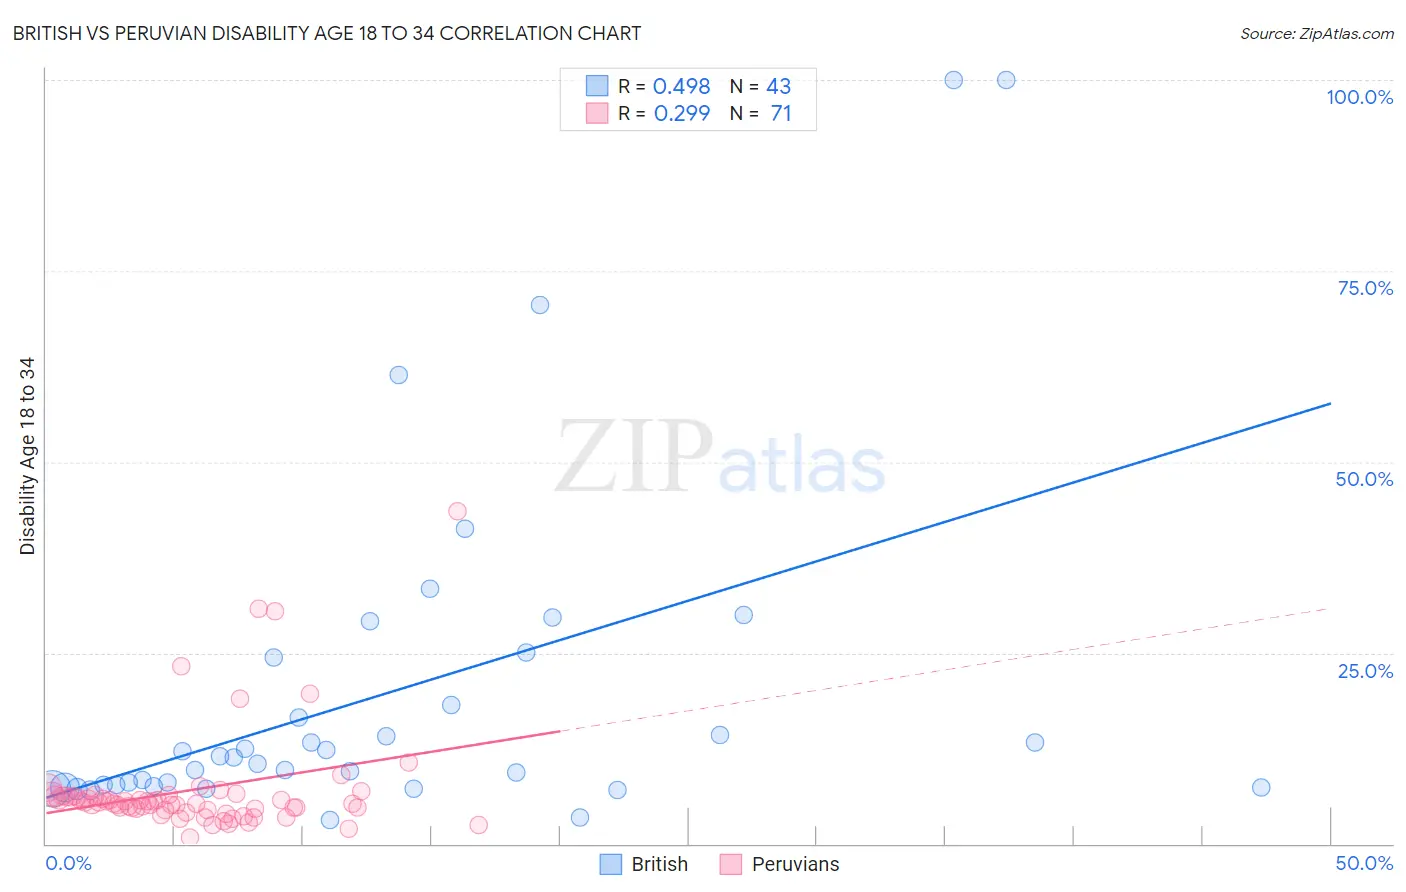
British vs Peruvian Disability Age 18 to 34 Correlation Chart
The statistical analysis conducted on geographies consisting of 528,221,956 people shows a moderate positive correlation between the proportion of British and percentage of population with a disability between the ages 18 and 35 in the United States with a correlation coefficient (R) of 0.498 and weighted average of 7.3%. Similarly, the statistical analysis conducted on geographies consisting of 362,638,552 people shows a weak positive correlation between the proportion of Peruvians and percentage of population with a disability between the ages 18 and 35 in the United States with a correlation coefficient (R) of 0.299 and weighted average of 6.0%, a difference of 22.7%.
Disability Age 18 to 34 Correlation Summary
| Measurement | British | Peruvian |
| Minimum | 3.0% | 0.85% |
| Maximum | 100.0% | 43.5% |
| Range | 97.0% | 42.7% |
| Mean | 19.9% | 7.0% |
| Median | 11.2% | 5.4% |
| Interquartile 25% (IQ1) | 7.5% | 4.5% |
| Interquartile 75% (IQ3) | 24.4% | 6.3% |
| Interquartile Range (IQR) | 16.9% | 1.8% |
| Standard Deviation (Sample) | 22.8% | 7.0% |
| Standard Deviation (Population) | 22.5% | 6.9% |
Similar Demographics by Disability Age 18 to 34
Demographics Similar to British by Disability Age 18 to 34
In terms of disability age 18 to 34, the demographic groups most similar to British are Bermudan (7.3%, a difference of 0.25%), Slovene (7.3%, a difference of 0.28%), Canadian (7.3%, a difference of 0.29%), Northern European (7.3%, a difference of 0.32%), and German Russian (7.4%, a difference of 0.44%).
| Demographics | Rating | Rank | Disability Age 18 to 34 |
| Immigrants | Laos | 0.4 /100 | #256 | Tragic 7.2% |
| Czechs | 0.3 /100 | #257 | Tragic 7.2% |
| Immigrants | Micronesia | 0.3 /100 | #258 | Tragic 7.3% |
| Somalis | 0.2 /100 | #259 | Tragic 7.3% |
| Tohono O'odham | 0.2 /100 | #260 | Tragic 7.3% |
| Northern Europeans | 0.2 /100 | #261 | Tragic 7.3% |
| Canadians | 0.2 /100 | #262 | Tragic 7.3% |
| British | 0.2 /100 | #263 | Tragic 7.3% |
| Bermudans | 0.1 /100 | #264 | Tragic 7.3% |
| Slovenes | 0.1 /100 | #265 | Tragic 7.3% |
| German Russians | 0.1 /100 | #266 | Tragic 7.4% |
| Bangladeshis | 0.1 /100 | #267 | Tragic 7.4% |
| Portuguese | 0.1 /100 | #268 | Tragic 7.4% |
| Basques | 0.1 /100 | #269 | Tragic 7.4% |
| Belgians | 0.1 /100 | #270 | Tragic 7.4% |
Demographics Similar to Peruvians by Disability Age 18 to 34
In terms of disability age 18 to 34, the demographic groups most similar to Peruvians are British West Indian (6.0%, a difference of 0.030%), Salvadoran (6.0%, a difference of 0.050%), Taiwanese (6.0%, a difference of 0.070%), Trinidadian and Tobagonian (6.0%, a difference of 0.21%), and Immigrants from Sri Lanka (6.0%, a difference of 0.28%).
| Demographics | Rating | Rank | Disability Age 18 to 34 |
| Immigrants | Spain | 99.7 /100 | #55 | Exceptional 5.9% |
| Paraguayans | 99.7 /100 | #56 | Exceptional 5.9% |
| Immigrants | Haiti | 99.7 /100 | #57 | Exceptional 5.9% |
| Immigrants | Serbia | 99.7 /100 | #58 | Exceptional 5.9% |
| Immigrants | Caribbean | 99.6 /100 | #59 | Exceptional 6.0% |
| Immigrants | Sri Lanka | 99.6 /100 | #60 | Exceptional 6.0% |
| British West Indians | 99.6 /100 | #61 | Exceptional 6.0% |
| Peruvians | 99.6 /100 | #62 | Exceptional 6.0% |
| Salvadorans | 99.6 /100 | #63 | Exceptional 6.0% |
| Taiwanese | 99.6 /100 | #64 | Exceptional 6.0% |
| Trinidadians and Tobagonians | 99.5 /100 | #65 | Exceptional 6.0% |
| Burmese | 99.5 /100 | #66 | Exceptional 6.0% |
| Immigrants | North Macedonia | 99.5 /100 | #67 | Exceptional 6.0% |
| Immigrants | Poland | 99.5 /100 | #68 | Exceptional 6.0% |
| Immigrants | West Indies | 99.4 /100 | #69 | Exceptional 6.0% |