Immigrants from Singapore vs Immigrants from Russia Disability
COMPARE
Immigrants from Singapore
Immigrants from Russia
Disability
Disability Comparison
Immigrants from Singapore
Immigrants from Russia
10.0%
DISABILITY
100.0/ 100
METRIC RATING
7th/ 347
METRIC RANK
11.1%
DISABILITY
98.9/ 100
METRIC RATING
86th/ 347
METRIC RANK
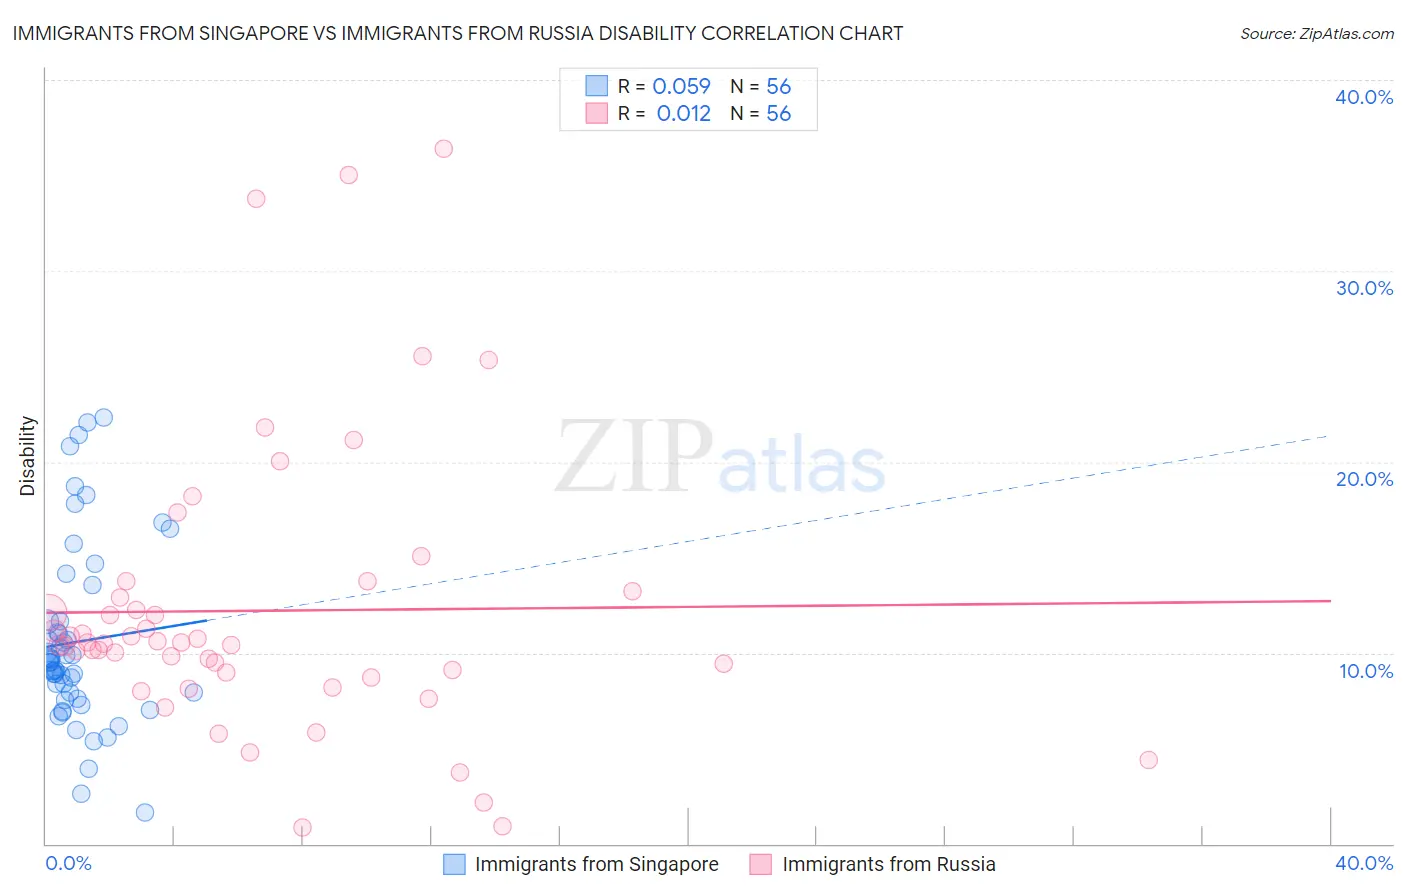
Immigrants from Singapore vs Immigrants from Russia Disability Correlation Chart
The statistical analysis conducted on geographies consisting of 137,520,897 people shows a slight positive correlation between the proportion of Immigrants from Singapore and percentage of population with a disability in the United States with a correlation coefficient (R) of 0.059 and weighted average of 10.0%. Similarly, the statistical analysis conducted on geographies consisting of 347,926,154 people shows no correlation between the proportion of Immigrants from Russia and percentage of population with a disability in the United States with a correlation coefficient (R) of 0.012 and weighted average of 11.1%, a difference of 11.4%.
Disability Correlation Summary
| Measurement | Immigrants from Singapore | Immigrants from Russia |
| Minimum | 1.6% | 0.87% |
| Maximum | 22.3% | 36.4% |
| Range | 20.7% | 35.5% |
| Mean | 10.6% | 12.2% |
| Median | 9.5% | 10.5% |
| Interquartile 25% (IQ1) | 7.7% | 8.9% |
| Interquartile 75% (IQ3) | 11.6% | 13.1% |
| Interquartile Range (IQR) | 3.9% | 4.2% |
| Standard Deviation (Sample) | 4.7% | 7.5% |
| Standard Deviation (Population) | 4.7% | 7.4% |
Similar Demographics by Disability
Demographics Similar to Immigrants from Singapore by Disability
In terms of disability, the demographic groups most similar to Immigrants from Singapore are Bolivian (10.0%, a difference of 0.23%), Immigrants from South Central Asia (9.9%, a difference of 0.31%), Immigrants from Hong Kong (10.0%, a difference of 0.52%), Immigrants from Bolivia (9.9%, a difference of 1.2%), and Immigrants from China (10.1%, a difference of 1.3%).
| Demographics | Rating | Rank | Disability |
| Immigrants | India | 100.0 /100 | #1 | Exceptional 9.5% |
| Filipinos | 100.0 /100 | #2 | Exceptional 9.6% |
| Immigrants | Taiwan | 100.0 /100 | #3 | Exceptional 9.6% |
| Thais | 100.0 /100 | #4 | Exceptional 9.7% |
| Immigrants | Bolivia | 100.0 /100 | #5 | Exceptional 9.9% |
| Immigrants | South Central Asia | 100.0 /100 | #6 | Exceptional 9.9% |
| Immigrants | Singapore | 100.0 /100 | #7 | Exceptional 10.0% |
| Bolivians | 100.0 /100 | #8 | Exceptional 10.0% |
| Immigrants | Hong Kong | 100.0 /100 | #9 | Exceptional 10.0% |
| Immigrants | China | 100.0 /100 | #10 | Exceptional 10.1% |
| Iranians | 100.0 /100 | #11 | Exceptional 10.1% |
| Immigrants | Israel | 100.0 /100 | #12 | Exceptional 10.1% |
| Immigrants | Eastern Asia | 100.0 /100 | #13 | Exceptional 10.2% |
| Immigrants | Korea | 100.0 /100 | #14 | Exceptional 10.2% |
| Okinawans | 100.0 /100 | #15 | Exceptional 10.3% |
Demographics Similar to Immigrants from Russia by Disability
In terms of disability, the demographic groups most similar to Immigrants from Russia are Immigrants from Belarus (11.1%, a difference of 0.0%), Palestinian (11.1%, a difference of 0.040%), Immigrants from Sierra Leone (11.1%, a difference of 0.15%), Immigrants from Switzerland (11.1%, a difference of 0.17%), and Chilean (11.1%, a difference of 0.20%).
| Demographics | Rating | Rank | Disability |
| Immigrants | Jordan | 99.3 /100 | #79 | Exceptional 11.1% |
| Immigrants | Ireland | 99.3 /100 | #80 | Exceptional 11.1% |
| Immigrants | Poland | 99.1 /100 | #81 | Exceptional 11.1% |
| Chileans | 99.1 /100 | #82 | Exceptional 11.1% |
| Immigrants | Switzerland | 99.0 /100 | #83 | Exceptional 11.1% |
| Immigrants | Sierra Leone | 99.0 /100 | #84 | Exceptional 11.1% |
| Immigrants | Belarus | 98.9 /100 | #85 | Exceptional 11.1% |
| Immigrants | Russia | 98.9 /100 | #86 | Exceptional 11.1% |
| Palestinians | 98.9 /100 | #87 | Exceptional 11.1% |
| Immigrants | Romania | 98.5 /100 | #88 | Exceptional 11.2% |
| Immigrants | South Africa | 98.2 /100 | #89 | Exceptional 11.2% |
| Immigrants | Brazil | 98.1 /100 | #90 | Exceptional 11.2% |
| Immigrants | Western Asia | 98.1 /100 | #91 | Exceptional 11.2% |
| Ecuadorians | 98.0 /100 | #92 | Exceptional 11.2% |
| Immigrants | Ecuador | 98.0 /100 | #93 | Exceptional 11.2% |