Immigrants from Western Europe vs Immigrants from Russia Disability

COMPARE

Immigrants from Western Europe
Race
Ancestry
AfghanAfricanAlaska NativeAlaskan AthabascanAlbanianAleutAlsatianAmericanApacheArabArapahoArgentineanArmenianAssyrian/Chaldean/SyriacAustralianAustrianBahamianBangladeshiBarbadianBasqueBelgianBelizeanBermudanBhutaneseBlackfeetBolivianBrazilianBritishBritish West IndianBulgarianBurmeseCajunCambodianCanadianCape VerdeanCarpatho RusynCelticCentral AmericanCentral American IndianCherokeeCheyenneChickasawChileanChineseChippewaChoctawColombianColvilleComancheCosta RicanCreeCreekCroatianCrowCubanCypriotCzechCzechoslovakianDanishDelawareDominicanDutchDutch West IndianEastern EuropeanEcuadorianEgyptianEnglishEstonianEthiopianEuropeanFijianFilipinoFinnishFrenchFrench American IndianFrench CanadianGermanGerman RussianGhanaianGreekGuamanian/ChamorroGuatemalanGuyaneseHaitianHmongHonduranHopiHoumaHungarianIcelanderIndian (Asian)IndonesianInupiatIranianIraqiIrishIroquoisIsraeliItalianJamaicanJapaneseJordanianKenyanKiowaKoreanLaotianLatvianLebaneseLiberianLithuanianLumbeeLuxembourgerMacedonianMalaysianMalteseMarshalleseMenomineeMexicanMexican American IndianMongolianMoroccanNative HawaiianNavajoNepaleseNew ZealanderNicaraguanNigerianNorthern EuropeanNorwegianOkinawanOsageOttawaPaiutePakistaniPalestinianPanamanianParaguayanPennsylvania GermanPeruvianPimaPolishPortuguesePotawatomiPuebloPuerto RicanPuget Sound SalishRomanianRussianSalvadoranSamoanScandinavianScotch-IrishScottishSeminoleSenegaleseSerbianShoshoneSierra LeoneanSiouxSlavicSlovakSloveneSomaliSouth AfricanSouth AmericanSouth American IndianSoviet UnionSpaniardSpanishSpanish AmericanSpanish American IndianSri LankanSubsaharan AfricanSudaneseSwedishSwissSyrianTaiwaneseThaiTlingit-HaidaTohono O'OdhamTonganTrinidadian and TobagonianTsimshianTurkishU.S. Virgin IslanderUgandanUkrainianUruguayanUteVenezuelanVietnameseWelshWest IndianYakamaYaquiYugoslavianYumanYup'ikZimbabwean
Immigration
NonimmigrantsImmigrantsAfghanistanAfricaAlbaniaArgentinaArmeniaAsiaAustraliaAustriaBahamasBangladeshBarbadosBelarusBelgiumBelizeBoliviaBosnia and HerzegovinaBrazilBulgariaBurma/MyanmarCabo VerdeCambodiaCameroonCanadaCaribbeanCentral AmericaChileChinaColombiaCongoCosta RicaCroatiaCubaCzechoslovakiaDenmarkDominicaDominican RepublicEastern AfricaEastern AsiaEastern EuropeEcuadorEgyptEl SalvadorEnglandEritreaEthiopiaEuropeFijiFranceGermanyGhanaGreeceGrenadaGuatemalaGuyanaHaitiHondurasHong KongHungaryIndiaIndonesiaIranIraqIrelandIsraelItalyJamaicaJapanJordanKazakhstanKenyaKoreaKuwaitLaosLatin AmericaLatviaLebanonLiberiaLithuaniaMalaysiaMexicoMicronesiaMiddle AfricaMoldovaMoroccoNepalNetherlandsNicaraguaNigeriaNorth AmericaNorth MacedoniaNorthern AfricaNorthern EuropeNorwayOceaniaPakistanPanamaPeruPhilippinesPolandPortugalRomaniaSaudi ArabiaScotlandSenegalSerbiaSierra LeoneSingaporeSomaliaSouth AfricaSouth AmericaSouth Central AsiaSouth Eastern AsiaSouthern EuropeSpainSri LankaSt. Vincent and the GrenadinesSudanSwedenSwitzerlandSyriaTaiwanThailandTrinidad and TobagoTurkeyUgandaUkraineUruguayUzbekistanVenezuelaVietnamWest IndiesWestern AfricaWestern AsiaWestern EuropeYemenZaireZimbabweAzores
Immigrants from Russia
Race
Ancestry
AfghanAfricanAlaska NativeAlaskan AthabascanAlbanianAleutAlsatianAmericanApacheArabArapahoArgentineanArmenianAssyrian/Chaldean/SyriacAustralianAustrianBahamianBangladeshiBarbadianBasqueBelgianBelizeanBermudanBhutaneseBlackfeetBolivianBrazilianBritishBritish West IndianBulgarianBurmeseCajunCambodianCanadianCape VerdeanCarpatho RusynCelticCentral AmericanCentral American IndianCherokeeCheyenneChickasawChileanChineseChippewaChoctawColombianColvilleComancheCosta RicanCreeCreekCroatianCrowCubanCypriotCzechCzechoslovakianDanishDelawareDominicanDutchDutch West IndianEastern EuropeanEcuadorianEgyptianEnglishEstonianEthiopianEuropeanFijianFilipinoFinnishFrenchFrench American IndianFrench CanadianGermanGerman RussianGhanaianGreekGuamanian/ChamorroGuatemalanGuyaneseHaitianHmongHonduranHopiHoumaHungarianIcelanderIndian (Asian)IndonesianInupiatIranianIraqiIrishIroquoisIsraeliItalianJamaicanJapaneseJordanianKenyanKiowaKoreanLaotianLatvianLebaneseLiberianLithuanianLumbeeLuxembourgerMacedonianMalaysianMalteseMarshalleseMenomineeMexicanMexican American IndianMongolianMoroccanNative HawaiianNavajoNepaleseNew ZealanderNicaraguanNigerianNorthern EuropeanNorwegianOkinawanOsageOttawaPaiutePakistaniPalestinianPanamanianParaguayanPennsylvania GermanPeruvianPimaPolishPortuguesePotawatomiPuebloPuerto RicanPuget Sound SalishRomanianRussianSalvadoranSamoanScandinavianScotch-IrishScottishSeminoleSenegaleseSerbianShoshoneSierra LeoneanSiouxSlavicSlovakSloveneSomaliSouth AfricanSouth AmericanSouth American IndianSoviet UnionSpaniardSpanishSpanish AmericanSpanish American IndianSri LankanSubsaharan AfricanSudaneseSwedishSwissSyrianTaiwaneseThaiTlingit-HaidaTohono O'OdhamTonganTrinidadian and TobagonianTsimshianTurkishU.S. Virgin IslanderUgandanUkrainianUruguayanUteVenezuelanVietnameseWelshWest IndianYakamaYaquiYugoslavianYumanYup'ikZimbabwean
Immigration
NonimmigrantsImmigrantsAfghanistanAfricaAlbaniaArgentinaArmeniaAsiaAustraliaAustriaBahamasBangladeshBarbadosBelarusBelgiumBelizeBoliviaBosnia and HerzegovinaBrazilBulgariaBurma/MyanmarCabo VerdeCambodiaCameroonCanadaCaribbeanCentral AmericaChileChinaColombiaCongoCosta RicaCroatiaCubaCzechoslovakiaDenmarkDominicaDominican RepublicEastern AfricaEastern AsiaEastern EuropeEcuadorEgyptEl SalvadorEnglandEritreaEthiopiaEuropeFijiFranceGermanyGhanaGreeceGrenadaGuatemalaGuyanaHaitiHondurasHong KongHungaryIndiaIndonesiaIranIraqIrelandIsraelItalyJamaicaJapanJordanKazakhstanKenyaKoreaKuwaitLaosLatin AmericaLatviaLebanonLiberiaLithuaniaMalaysiaMexicoMicronesiaMiddle AfricaMoldovaMoroccoNepalNetherlandsNicaraguaNigeriaNorth AmericaNorth MacedoniaNorthern AfricaNorthern EuropeNorwayOceaniaPakistanPanamaPeruPhilippinesPolandPortugalRomaniaRussiaSaudi ArabiaScotlandSenegalSerbiaSierra LeoneSingaporeSomaliaSouth AfricaSouth AmericaSouth Central AsiaSouth Eastern AsiaSouthern EuropeSpainSri LankaSt. Vincent and the GrenadinesSudanSwedenSwitzerlandSyriaTaiwanThailandTrinidad and TobagoTurkeyUgandaUkraineUruguayUzbekistanVenezuelaVietnamWest IndiesWestern AfricaWestern AsiaYemenZaireZimbabweAzores
Disability
Income
Poverty
Unemployment
Labor Participation
Family Structure
Vehicle Availability
Education Level
Disability

Disability Comparison

Immigrants from Western Europe

Immigrants from Russia

Poor
Exceptional
12.0%
DISABILITY
10.1/ 100
METRIC RATING
205th/ 347
METRIC RANK
11.1%
DISABILITY
98.9/ 100
METRIC RATING
86th/ 347
METRIC RANK

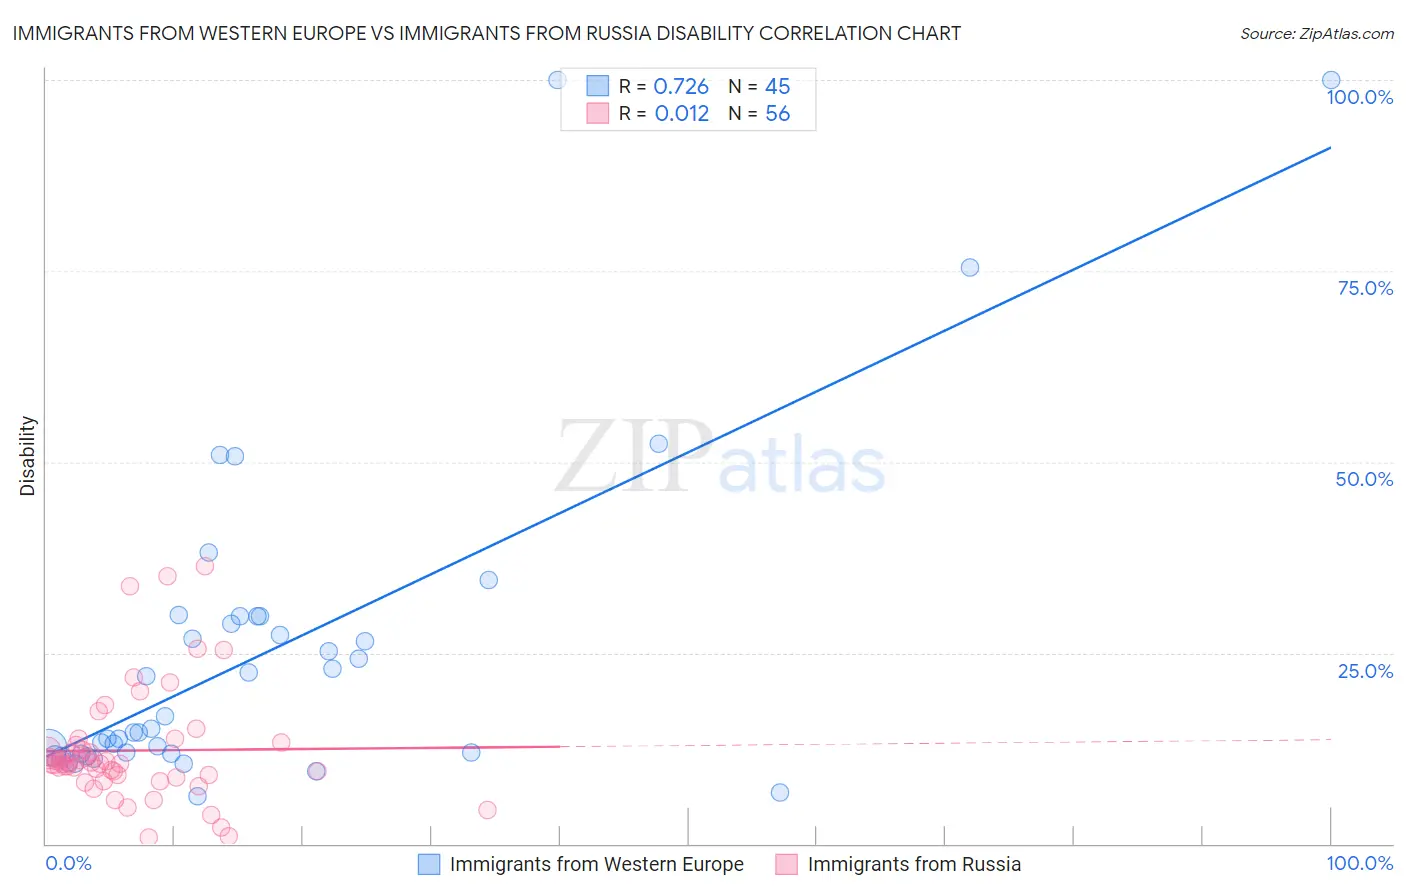
Immigrants from Western Europe vs Immigrants from Russia Disability Correlation Chart

The statistical analysis conducted on geographies consisting of 494,041,803 people shows a strong positive correlation between the proportion of Immigrants from Western Europe and percentage of population with a disability in the United States with a correlation coefficient (R) of 0.726 and weighted average of 12.0%. Similarly, the statistical analysis conducted on geographies consisting of 347,926,154 people shows no correlation between the proportion of Immigrants from Russia and percentage of population with a disability in the United States with a correlation coefficient (R) of 0.012 and weighted average of 11.1%, a difference of 7.8%.
Immigrants from Western Europe vs Immigrants from Russia Disability

Disability Correlation Summary

MeasurementImmigrants from Western EuropeImmigrants from Russia
Minimum6.3%0.87%
Maximum100.0%36.4%
Range93.7%35.5%
Mean25.2%12.2%
Median15.0%10.5%
Interquartile 25% (IQ1)11.7%8.9%
Interquartile 75% (IQ3)29.8%13.1%
Interquartile Range (IQR)18.0%4.2%
Standard Deviation (Sample)21.6%7.5%
Standard Deviation (Population)21.3%7.4%

Similar Demographics by Disability

Demographics Similar to Immigrants from Western Europe by Disability

In terms of disability, the demographic groups most similar to Immigrants from Western Europe are Immigrants from Senegal (12.0%, a difference of 0.080%), Immigrants from Thailand (12.0%, a difference of 0.10%), Immigrants from Caribbean (12.0%, a difference of 0.12%), British West Indian (12.0%, a difference of 0.16%), and Mexican American Indian (12.0%, a difference of 0.16%).
DemographicsRating | RankDisability
Ukrainians
14.7
/100
|
#198
Poor
11.9%
Immigrants | Panama
14.6
/100
|
#199
Poor
11.9%
Belizeans
12.8
/100
|
#200
Poor
11.9%
Assyrians/Chaldeans/Syriacs
12.6
/100
|
#201
Poor
11.9%
Immigrants | England
12.0
/100
|
#202
Poor
12.0%
British West Indians
11.5
/100
|
#203
Poor
12.0%
Mexican American Indians
11.4
/100
|
#204
Poor
12.0%
Immigrants | Western Europe
10.1
/100
|
#205
Poor
12.0%
Immigrants | Senegal
9.4
/100
|
#206
Tragic
12.0%
Immigrants | Thailand
9.3
/100
|
#207
Tragic
12.0%
Immigrants | Caribbean
9.1
/100
|
#208
Tragic
12.0%
Danes
8.7
/100
|
#209
Tragic
12.0%
Czechs
7.9
/100
|
#210
Tragic
12.0%
Immigrants | Cambodia
7.3
/100
|
#211
Tragic
12.0%
Austrians
7.2
/100
|
#212
Tragic
12.0%

Demographics Similar to Immigrants from Russia by Disability

In terms of disability, the demographic groups most similar to Immigrants from Russia are Immigrants from Belarus (11.1%, a difference of 0.0%), Palestinian (11.1%, a difference of 0.040%), Immigrants from Sierra Leone (11.1%, a difference of 0.15%), Immigrants from Switzerland (11.1%, a difference of 0.17%), and Chilean (11.1%, a difference of 0.20%).
DemographicsRating | RankDisability
Immigrants | Jordan
99.3
/100
|
#79
Exceptional
11.1%
Immigrants | Ireland
99.3
/100
|
#80
Exceptional
11.1%
Immigrants | Poland
99.1
/100
|
#81
Exceptional
11.1%
Chileans
99.1
/100
|
#82
Exceptional
11.1%
Immigrants | Switzerland
99.0
/100
|
#83
Exceptional
11.1%
Immigrants | Sierra Leone
99.0
/100
|
#84
Exceptional
11.1%
Immigrants | Belarus
98.9
/100
|
#85
Exceptional
11.1%
Immigrants | Russia
98.9
/100
|
#86
Exceptional
11.1%
Palestinians
98.9
/100
|
#87
Exceptional
11.1%
Immigrants | Romania
98.5
/100
|
#88
Exceptional
11.2%
Immigrants | South Africa
98.2
/100
|
#89
Exceptional
11.2%
Immigrants | Brazil
98.1
/100
|
#90
Exceptional
11.2%
Immigrants | Western Asia
98.1
/100
|
#91
Exceptional
11.2%
Ecuadorians
98.0
/100
|
#92
Exceptional
11.2%
Immigrants | Ecuador
98.0
/100
|
#93
Exceptional
11.2%