Immigrants from Africa vs Immigrants from Russia Disability
COMPARE
Immigrants from Africa
Immigrants from Russia
Disability
Disability Comparison
Immigrants from Africa
Immigrants from Russia
11.4%
DISABILITY
89.3/ 100
METRIC RATING
132nd/ 347
METRIC RANK
11.1%
DISABILITY
98.9/ 100
METRIC RATING
86th/ 347
METRIC RANK
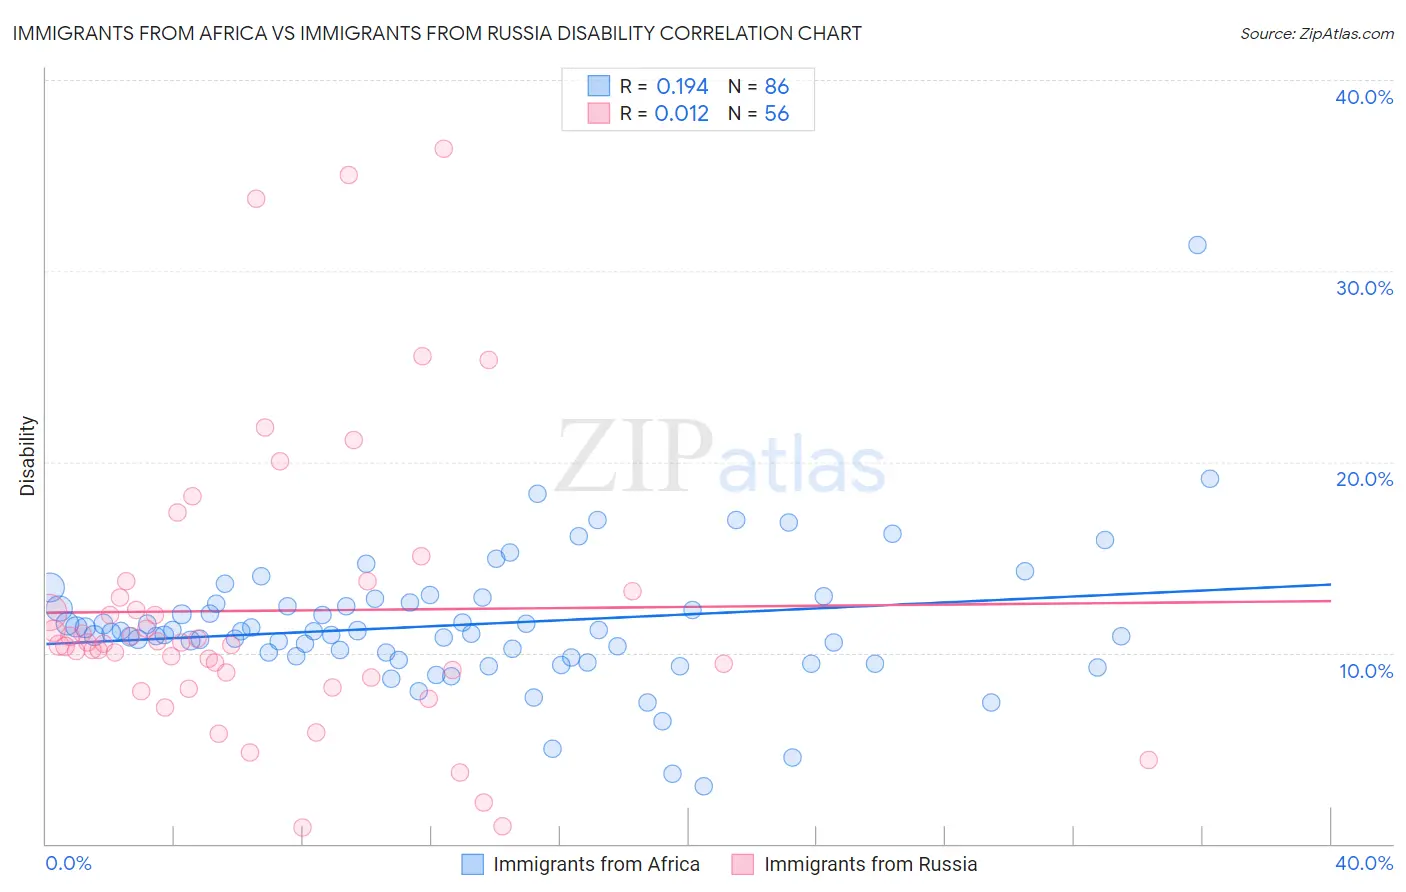
Immigrants from Africa vs Immigrants from Russia Disability Correlation Chart
The statistical analysis conducted on geographies consisting of 469,357,699 people shows a poor positive correlation between the proportion of Immigrants from Africa and percentage of population with a disability in the United States with a correlation coefficient (R) of 0.194 and weighted average of 11.4%. Similarly, the statistical analysis conducted on geographies consisting of 347,926,154 people shows no correlation between the proportion of Immigrants from Russia and percentage of population with a disability in the United States with a correlation coefficient (R) of 0.012 and weighted average of 11.1%, a difference of 2.8%.
Disability Correlation Summary
| Measurement | Immigrants from Africa | Immigrants from Russia |
| Minimum | 3.0% | 0.87% |
| Maximum | 31.3% | 36.4% |
| Range | 28.3% | 35.5% |
| Mean | 11.5% | 12.2% |
| Median | 11.1% | 10.5% |
| Interquartile 25% (IQ1) | 9.8% | 8.9% |
| Interquartile 75% (IQ3) | 12.6% | 13.1% |
| Interquartile Range (IQR) | 2.8% | 4.2% |
| Standard Deviation (Sample) | 3.6% | 7.5% |
| Standard Deviation (Population) | 3.6% | 7.4% |
Similar Demographics by Disability
Demographics Similar to Immigrants from Africa by Disability
In terms of disability, the demographic groups most similar to Immigrants from Africa are Arab (11.4%, a difference of 0.030%), Immigrants from Croatia (11.4%, a difference of 0.060%), Latvian (11.4%, a difference of 0.070%), Immigrants from Guyana (11.4%, a difference of 0.11%), and Macedonian (11.4%, a difference of 0.12%).
| Demographics | Rating | Rank | Disability |
| Costa Ricans | 91.9 /100 | #125 | Exceptional 11.4% |
| Immigrants | Latvia | 90.9 /100 | #126 | Exceptional 11.4% |
| Immigrants | Italy | 90.4 /100 | #127 | Exceptional 11.4% |
| Immigrants | Europe | 90.4 /100 | #128 | Exceptional 11.4% |
| Macedonians | 90.3 /100 | #129 | Exceptional 11.4% |
| Latvians | 89.8 /100 | #130 | Excellent 11.4% |
| Immigrants | Croatia | 89.8 /100 | #131 | Excellent 11.4% |
| Immigrants | Africa | 89.3 /100 | #132 | Excellent 11.4% |
| Arabs | 89.1 /100 | #133 | Excellent 11.4% |
| Immigrants | Guyana | 88.3 /100 | #134 | Excellent 11.4% |
| Ugandans | 87.9 /100 | #135 | Excellent 11.4% |
| Immigrants | St. Vincent and the Grenadines | 87.8 /100 | #136 | Excellent 11.4% |
| Kenyans | 87.1 /100 | #137 | Excellent 11.5% |
| New Zealanders | 87.0 /100 | #138 | Excellent 11.5% |
| Ghanaians | 87.0 /100 | #139 | Excellent 11.5% |
Demographics Similar to Immigrants from Russia by Disability
In terms of disability, the demographic groups most similar to Immigrants from Russia are Immigrants from Belarus (11.1%, a difference of 0.0%), Palestinian (11.1%, a difference of 0.040%), Immigrants from Sierra Leone (11.1%, a difference of 0.15%), Immigrants from Switzerland (11.1%, a difference of 0.17%), and Chilean (11.1%, a difference of 0.20%).
| Demographics | Rating | Rank | Disability |
| Immigrants | Jordan | 99.3 /100 | #79 | Exceptional 11.1% |
| Immigrants | Ireland | 99.3 /100 | #80 | Exceptional 11.1% |
| Immigrants | Poland | 99.1 /100 | #81 | Exceptional 11.1% |
| Chileans | 99.1 /100 | #82 | Exceptional 11.1% |
| Immigrants | Switzerland | 99.0 /100 | #83 | Exceptional 11.1% |
| Immigrants | Sierra Leone | 99.0 /100 | #84 | Exceptional 11.1% |
| Immigrants | Belarus | 98.9 /100 | #85 | Exceptional 11.1% |
| Immigrants | Russia | 98.9 /100 | #86 | Exceptional 11.1% |
| Palestinians | 98.9 /100 | #87 | Exceptional 11.1% |
| Immigrants | Romania | 98.5 /100 | #88 | Exceptional 11.2% |
| Immigrants | South Africa | 98.2 /100 | #89 | Exceptional 11.2% |
| Immigrants | Brazil | 98.1 /100 | #90 | Exceptional 11.2% |
| Immigrants | Western Asia | 98.1 /100 | #91 | Exceptional 11.2% |
| Ecuadorians | 98.0 /100 | #92 | Exceptional 11.2% |
| Immigrants | Ecuador | 98.0 /100 | #93 | Exceptional 11.2% |