Finnish vs Dutch Disability Age Over 75
COMPARE
Finnish
Dutch
Disability Age Over 75
Disability Age Over 75 Comparison
Finns
Dutch
46.3%
DISABILITY AGE OVER 75
97.9/ 100
METRIC RATING
97th/ 347
METRIC RANK
46.5%
DISABILITY AGE OVER 75
95.9/ 100
METRIC RATING
114th/ 347
METRIC RANK
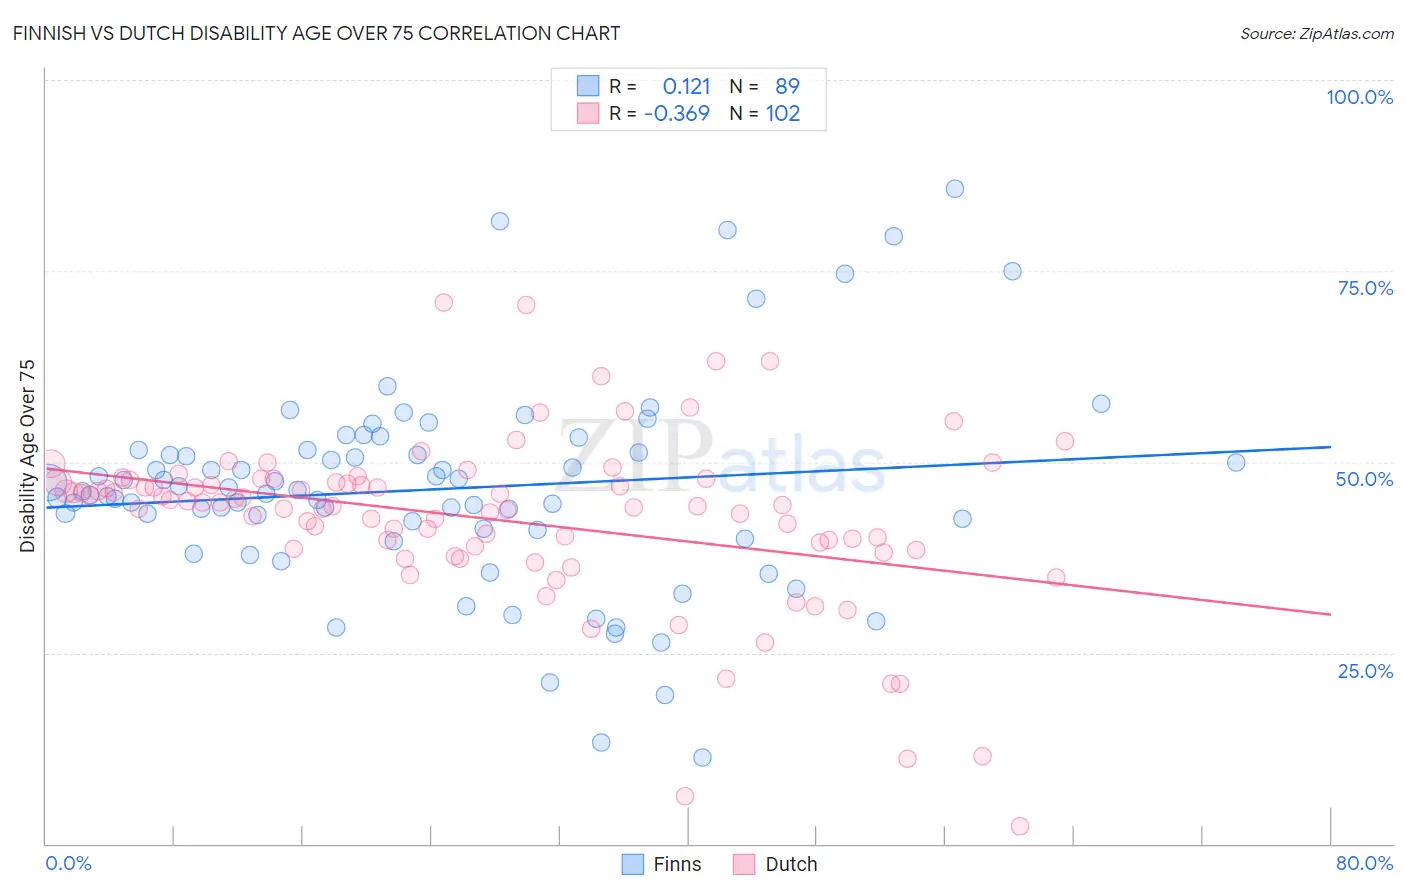
Finnish vs Dutch Disability Age Over 75 Correlation Chart
The statistical analysis conducted on geographies consisting of 404,104,832 people shows a poor positive correlation between the proportion of Finns and percentage of population with a disability over the age of 75 in the United States with a correlation coefficient (R) of 0.121 and weighted average of 46.3%. Similarly, the statistical analysis conducted on geographies consisting of 552,623,660 people shows a mild negative correlation between the proportion of Dutch and percentage of population with a disability over the age of 75 in the United States with a correlation coefficient (R) of -0.369 and weighted average of 46.5%, a difference of 0.39%.
Disability Age Over 75 Correlation Summary
| Measurement | Finnish | Dutch |
| Minimum | 11.3% | 2.2% |
| Maximum | 85.7% | 70.9% |
| Range | 74.4% | 68.6% |
| Mean | 46.4% | 42.6% |
| Median | 46.1% | 44.5% |
| Interquartile 25% (IQ1) | 41.1% | 39.0% |
| Interquartile 75% (IQ3) | 51.3% | 47.3% |
| Interquartile Range (IQR) | 10.2% | 8.4% |
| Standard Deviation (Sample) | 13.5% | 11.2% |
| Standard Deviation (Population) | 13.4% | 11.1% |
Demographics Similar to Finns and Dutch by Disability Age Over 75
In terms of disability age over 75, the demographic groups most similar to Finns are Immigrants from Japan (46.3%, a difference of 0.010%), Immigrants from China (46.3%, a difference of 0.020%), Immigrants from Brazil (46.3%, a difference of 0.030%), Palestinian (46.3%, a difference of 0.050%), and Immigrants from Eastern Europe (46.3%, a difference of 0.050%). Similarly, the demographic groups most similar to Dutch are Irish (46.5%, a difference of 0.010%), British (46.5%, a difference of 0.020%), Immigrants from Pakistan (46.5%, a difference of 0.030%), Immigrants from Hong Kong (46.5%, a difference of 0.070%), and Immigrants from Chile (46.5%, a difference of 0.070%).
| Demographics | Rating | Rank | Disability Age Over 75 |
| Immigrants | Brazil | 98.0 /100 | #95 | Exceptional 46.3% |
| Immigrants | China | 98.0 /100 | #96 | Exceptional 46.3% |
| Finns | 97.9 /100 | #97 | Exceptional 46.3% |
| Immigrants | Japan | 97.8 /100 | #98 | Exceptional 46.3% |
| Palestinians | 97.7 /100 | #99 | Exceptional 46.3% |
| Immigrants | Eastern Europe | 97.7 /100 | #100 | Exceptional 46.3% |
| Mongolians | 97.7 /100 | #101 | Exceptional 46.3% |
| Immigrants | Malaysia | 97.1 /100 | #102 | Exceptional 46.4% |
| Ukrainians | 97.1 /100 | #103 | Exceptional 46.4% |
| Israelis | 97.0 /100 | #104 | Exceptional 46.4% |
| Immigrants | Cameroon | 96.9 /100 | #105 | Exceptional 46.4% |
| Immigrants | Kuwait | 96.8 /100 | #106 | Exceptional 46.4% |
| Immigrants | Uruguay | 96.7 /100 | #107 | Exceptional 46.4% |
| Brazilians | 96.6 /100 | #108 | Exceptional 46.5% |
| Chileans | 96.4 /100 | #109 | Exceptional 46.5% |
| Immigrants | Hong Kong | 96.4 /100 | #110 | Exceptional 46.5% |
| Immigrants | Chile | 96.4 /100 | #111 | Exceptional 46.5% |
| Immigrants | Pakistan | 96.1 /100 | #112 | Exceptional 46.5% |
| Irish | 96.0 /100 | #113 | Exceptional 46.5% |
| Dutch | 95.9 /100 | #114 | Exceptional 46.5% |
| British | 95.7 /100 | #115 | Exceptional 46.5% |