Immigrants from South America vs Jamaican Disability Age Under 5
COMPARE
Immigrants from South America
Jamaican
Disability Age Under 5
Disability Age Under 5 Comparison
Immigrants from South America
Jamaicans
1.2%
DISABILITY AGE UNDER 5
67.0/ 100
METRIC RATING
157th/ 347
METRIC RANK
1.3%
DISABILITY AGE UNDER 5
30.7/ 100
METRIC RATING
199th/ 347
METRIC RANK
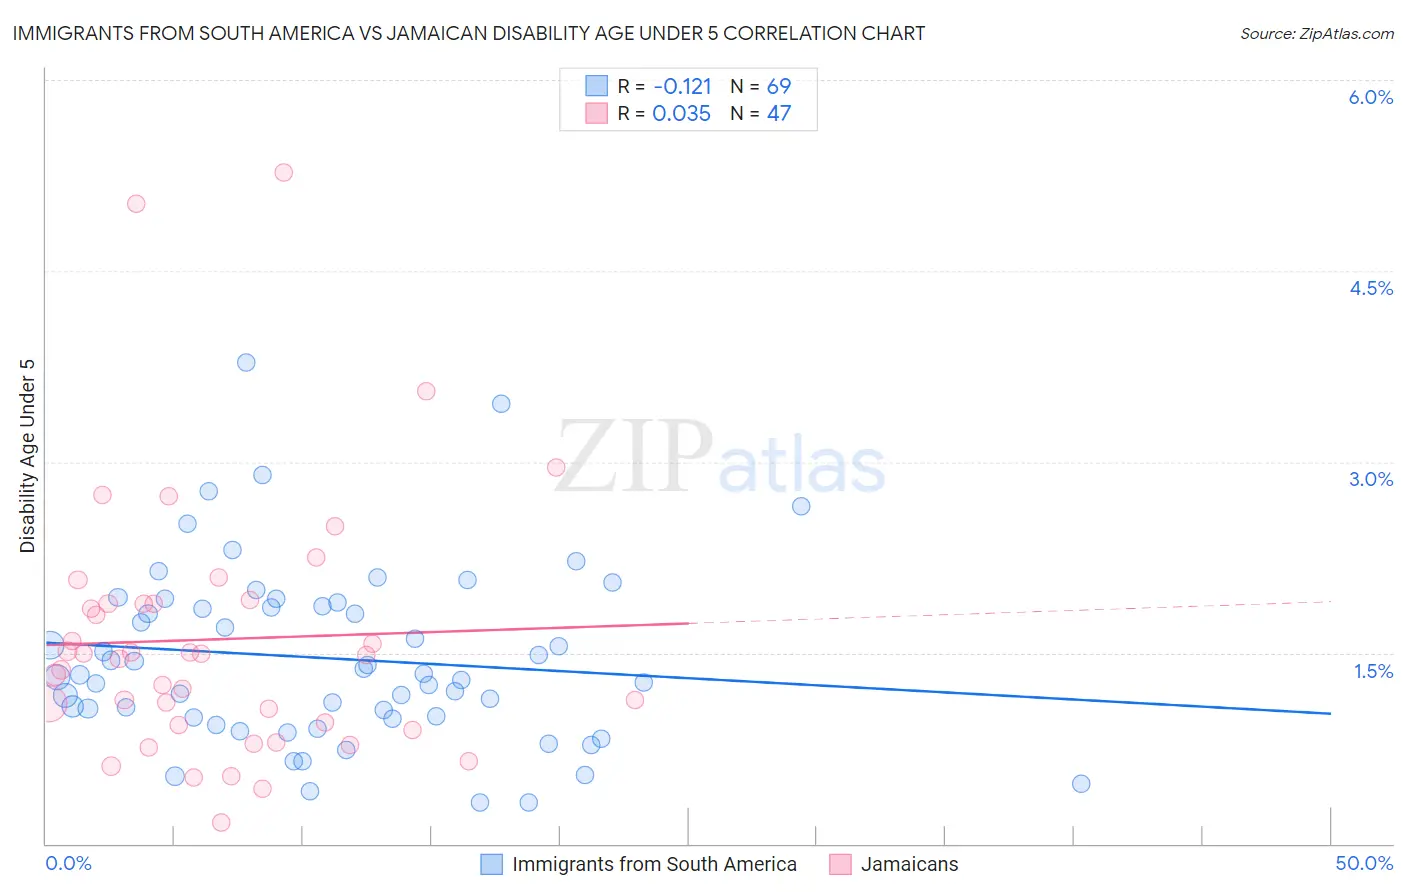
Immigrants from South America vs Jamaican Disability Age Under 5 Correlation Chart
The statistical analysis conducted on geographies consisting of 244,519,101 people shows a poor negative correlation between the proportion of Immigrants from South America and percentage of population with a disability under the age of 5 in the United States with a correlation coefficient (R) of -0.121 and weighted average of 1.2%. Similarly, the statistical analysis conducted on geographies consisting of 204,154,709 people shows no correlation between the proportion of Jamaicans and percentage of population with a disability under the age of 5 in the United States with a correlation coefficient (R) of 0.035 and weighted average of 1.3%, a difference of 3.5%.
Disability Age Under 5 Correlation Summary
| Measurement | Immigrants from South America | Jamaican |
| Minimum | 0.32% | 0.17% |
| Maximum | 3.8% | 5.3% |
| Range | 3.5% | 5.1% |
| Mean | 1.5% | 1.6% |
| Median | 1.3% | 1.5% |
| Interquartile 25% (IQ1) | 0.99% | 0.93% |
| Interquartile 75% (IQ3) | 1.9% | 1.9% |
| Interquartile Range (IQR) | 0.89% | 0.95% |
| Standard Deviation (Sample) | 0.70% | 1.0% |
| Standard Deviation (Population) | 0.70% | 1.0% |
Similar Demographics by Disability Age Under 5
Demographics Similar to Immigrants from South America by Disability Age Under 5
In terms of disability age under 5, the demographic groups most similar to Immigrants from South America are Arab (1.2%, a difference of 0.060%), Colombian (1.2%, a difference of 0.12%), Immigrants from Latin America (1.2%, a difference of 0.12%), Hawaiian (1.2%, a difference of 0.16%), and Immigrants from Ghana (1.2%, a difference of 0.18%).
| Demographics | Rating | Rank | Disability Age Under 5 |
| South Americans | 75.6 /100 | #150 | Good 1.2% |
| Yaqui | 74.8 /100 | #151 | Good 1.2% |
| Hondurans | 72.5 /100 | #152 | Good 1.2% |
| Immigrants | Thailand | 69.4 /100 | #153 | Good 1.2% |
| Uruguayans | 68.8 /100 | #154 | Good 1.2% |
| Immigrants | Ghana | 68.7 /100 | #155 | Good 1.2% |
| Hawaiians | 68.5 /100 | #156 | Good 1.2% |
| Immigrants | South America | 67.0 /100 | #157 | Good 1.2% |
| Arabs | 66.4 /100 | #158 | Good 1.2% |
| Colombians | 65.8 /100 | #159 | Good 1.2% |
| Immigrants | Latin America | 65.8 /100 | #160 | Good 1.2% |
| Immigrants | Africa | 65.1 /100 | #161 | Good 1.2% |
| Guatemalans | 63.6 /100 | #162 | Good 1.2% |
| Immigrants | Guatemala | 63.2 /100 | #163 | Good 1.2% |
| Laotians | 62.8 /100 | #164 | Good 1.2% |
Demographics Similar to Jamaicans by Disability Age Under 5
In terms of disability age under 5, the demographic groups most similar to Jamaicans are Immigrants from Norway (1.3%, a difference of 0.040%), Immigrants from Somalia (1.3%, a difference of 0.070%), Immigrants from Belgium (1.3%, a difference of 0.080%), U.S. Virgin Islander (1.3%, a difference of 0.38%), and Immigrants from Lithuania (1.3%, a difference of 0.38%).
| Demographics | Rating | Rank | Disability Age Under 5 |
| Immigrants | Bosnia and Herzegovina | 36.5 /100 | #192 | Fair 1.3% |
| Immigrants | Sierra Leone | 36.5 /100 | #193 | Fair 1.3% |
| Immigrants | North Macedonia | 34.7 /100 | #194 | Fair 1.3% |
| U.S. Virgin Islanders | 34.4 /100 | #195 | Fair 1.3% |
| Immigrants | Belgium | 31.4 /100 | #196 | Fair 1.3% |
| Immigrants | Somalia | 31.3 /100 | #197 | Fair 1.3% |
| Immigrants | Norway | 31.1 /100 | #198 | Fair 1.3% |
| Jamaicans | 30.7 /100 | #199 | Fair 1.3% |
| Immigrants | Lithuania | 27.2 /100 | #200 | Fair 1.3% |
| Immigrants | Italy | 25.4 /100 | #201 | Fair 1.3% |
| Arapaho | 24.1 /100 | #202 | Fair 1.3% |
| Liberians | 24.0 /100 | #203 | Fair 1.3% |
| Immigrants | Europe | 23.6 /100 | #204 | Fair 1.3% |
| Romanians | 22.5 /100 | #205 | Fair 1.3% |
| Immigrants | Poland | 22.4 /100 | #206 | Fair 1.3% |