Greek vs Jamaican 1 or more Vehicles in Household
COMPARE
Greek
Jamaican
1 or more Vehicles in Household
1 or more Vehicles in Household Comparison
Greeks
Jamaicans
90.6%
1 OR MORE VEHICLES IN HOUSEHOLD
93.5/ 100
METRIC RATING
117th/ 347
METRIC RANK
82.1%
1 OR MORE VEHICLES IN HOUSEHOLD
0.0/ 100
METRIC RATING
321st/ 347
METRIC RANK
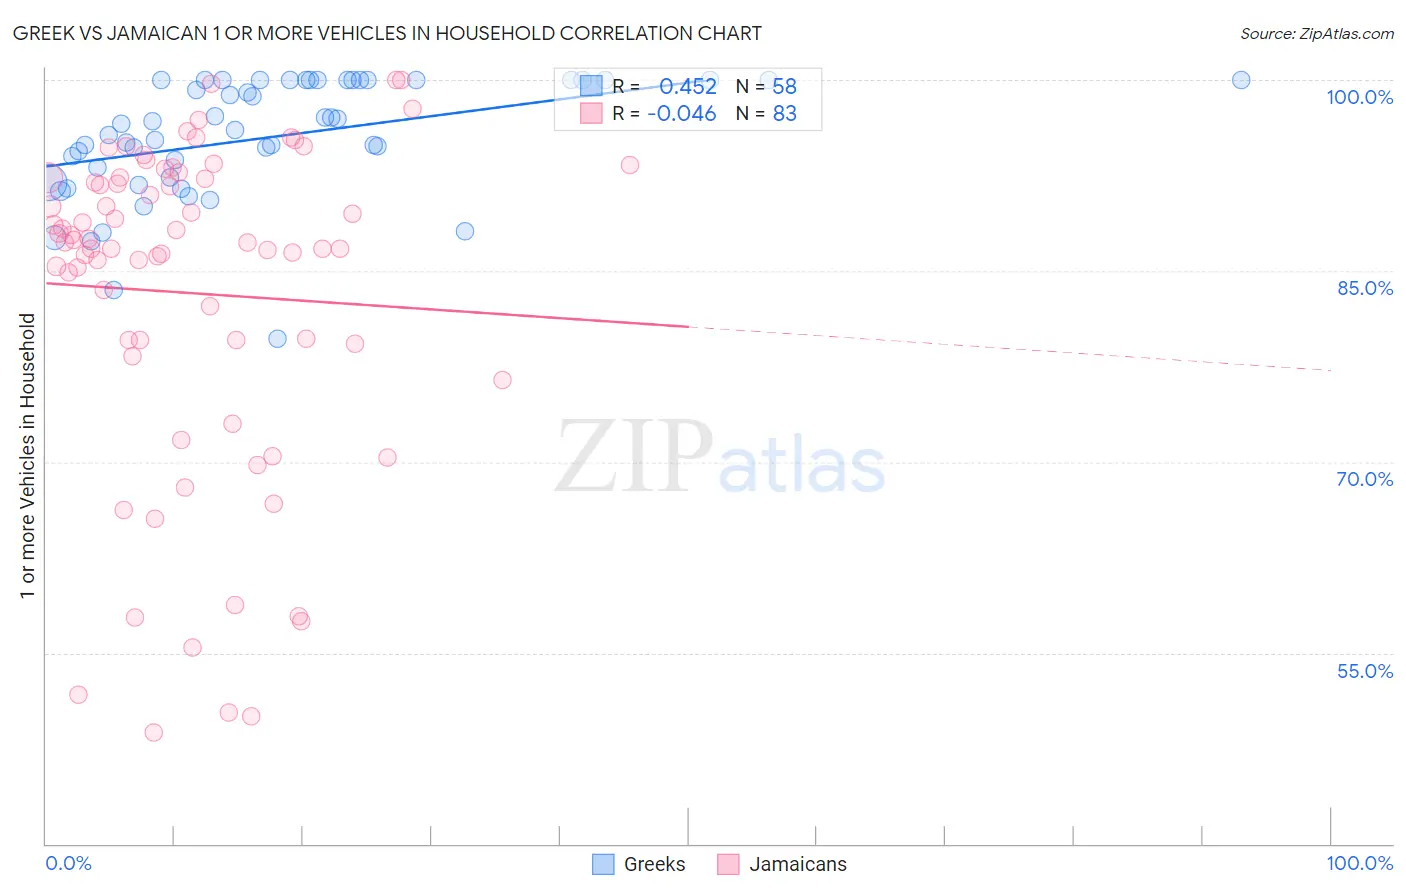
Greek vs Jamaican 1 or more Vehicles in Household Correlation Chart
The statistical analysis conducted on geographies consisting of 482,364,894 people shows a moderate positive correlation between the proportion of Greeks and percentage of households with 1 or more vehicles available in the United States with a correlation coefficient (R) of 0.452 and weighted average of 90.6%. Similarly, the statistical analysis conducted on geographies consisting of 367,719,271 people shows no correlation between the proportion of Jamaicans and percentage of households with 1 or more vehicles available in the United States with a correlation coefficient (R) of -0.046 and weighted average of 82.1%, a difference of 10.3%.
1 or more Vehicles in Household Correlation Summary
| Measurement | Greek | Jamaican |
| Minimum | 79.7% | 48.7% |
| Maximum | 100.0% | 100.0% |
| Range | 20.3% | 51.3% |
| Mean | 95.5% | 83.3% |
| Median | 96.3% | 87.2% |
| Interquartile 25% (IQ1) | 92.4% | 79.3% |
| Interquartile 75% (IQ3) | 100.0% | 92.3% |
| Interquartile Range (IQR) | 7.6% | 13.0% |
| Standard Deviation (Sample) | 4.7% | 13.0% |
| Standard Deviation (Population) | 4.7% | 12.9% |
Similar Demographics by 1 or more Vehicles in Household
Demographics Similar to Greeks by 1 or more Vehicles in Household
In terms of 1 or more vehicles in household, the demographic groups most similar to Greeks are Japanese (90.6%, a difference of 0.010%), Serbian (90.7%, a difference of 0.050%), Chippewa (90.7%, a difference of 0.050%), Blackfeet (90.6%, a difference of 0.050%), and Armenian (90.7%, a difference of 0.070%).
| Demographics | Rating | Rank | 1 or more Vehicles in Household |
| Mexican American Indians | 97.4 /100 | #110 | Exceptional 91.0% |
| Navajo | 95.8 /100 | #111 | Exceptional 90.8% |
| Immigrants | Netherlands | 95.7 /100 | #112 | Exceptional 90.8% |
| Immigrants | Kuwait | 94.7 /100 | #113 | Exceptional 90.7% |
| Armenians | 94.5 /100 | #114 | Exceptional 90.7% |
| Serbians | 94.3 /100 | #115 | Exceptional 90.7% |
| Chippewa | 94.3 /100 | #116 | Exceptional 90.7% |
| Greeks | 93.5 /100 | #117 | Exceptional 90.6% |
| Japanese | 93.4 /100 | #118 | Exceptional 90.6% |
| Blackfeet | 92.6 /100 | #119 | Exceptional 90.6% |
| Immigrants | Thailand | 92.3 /100 | #120 | Exceptional 90.6% |
| Icelanders | 92.1 /100 | #121 | Exceptional 90.5% |
| Costa Ricans | 92.0 /100 | #122 | Exceptional 90.5% |
| Fijians | 91.8 /100 | #123 | Exceptional 90.5% |
| Puget Sound Salish | 91.5 /100 | #124 | Exceptional 90.5% |
Demographics Similar to Jamaicans by 1 or more Vehicles in Household
In terms of 1 or more vehicles in household, the demographic groups most similar to Jamaicans are Soviet Union (82.7%, a difference of 0.64%), Immigrants from Cabo Verde (81.6%, a difference of 0.67%), Immigrants from Belarus (83.3%, a difference of 1.5%), Immigrants from Ghana (83.4%, a difference of 1.6%), and Ghanaian (83.6%, a difference of 1.8%).
| Demographics | Rating | Rank | 1 or more Vehicles in Household |
| Albanians | 0.0 /100 | #314 | Tragic 84.4% |
| Cypriots | 0.0 /100 | #315 | Tragic 84.4% |
| Alaska Natives | 0.0 /100 | #316 | Tragic 83.8% |
| Ghanaians | 0.0 /100 | #317 | Tragic 83.6% |
| Immigrants | Ghana | 0.0 /100 | #318 | Tragic 83.4% |
| Immigrants | Belarus | 0.0 /100 | #319 | Tragic 83.3% |
| Soviet Union | 0.0 /100 | #320 | Tragic 82.7% |
| Jamaicans | 0.0 /100 | #321 | Tragic 82.1% |
| Immigrants | Cabo Verde | 0.0 /100 | #322 | Tragic 81.6% |
| Immigrants | Yemen | 0.0 /100 | #323 | Tragic 80.5% |
| Immigrants | Caribbean | 0.0 /100 | #324 | Tragic 80.4% |
| Senegalese | 0.0 /100 | #325 | Tragic 80.4% |
| Immigrants | West Indies | 0.0 /100 | #326 | Tragic 79.5% |
| Immigrants | Senegal | 0.0 /100 | #327 | Tragic 79.0% |
| Ecuadorians | 0.0 /100 | #328 | Tragic 77.9% |