Greek vs African Ambulatory Disability
COMPARE
Greek
African
Ambulatory Disability
Ambulatory Disability Comparison
Greeks
Africans
6.0%
AMBULATORY DISABILITY
79.6/ 100
METRIC RATING
151st/ 347
METRIC RANK
7.0%
AMBULATORY DISABILITY
0.0/ 100
METRIC RATING
303rd/ 347
METRIC RANK
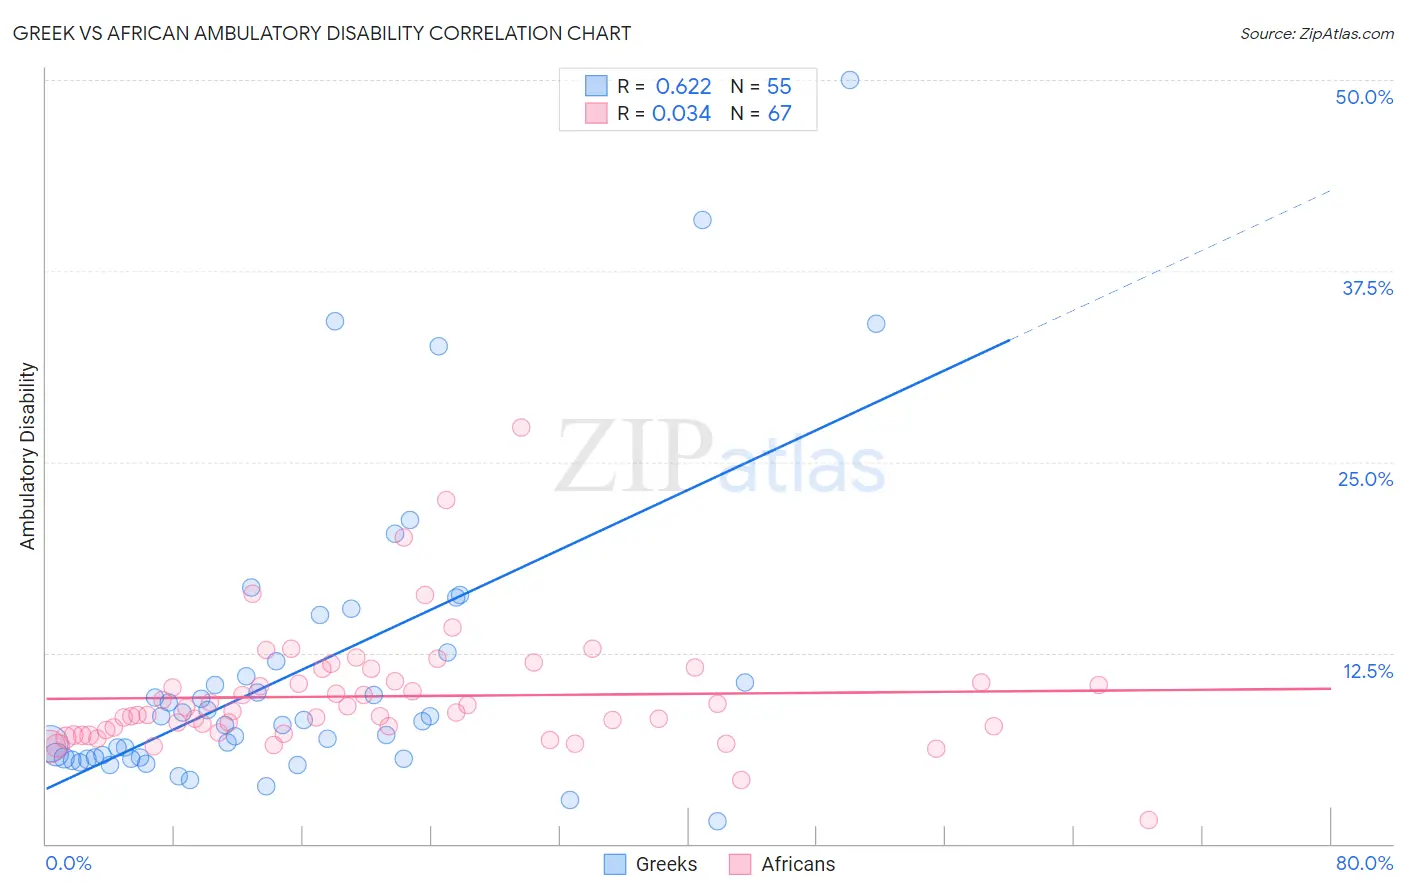
Greek vs African Ambulatory Disability Correlation Chart
The statistical analysis conducted on geographies consisting of 482,531,888 people shows a significant positive correlation between the proportion of Greeks and percentage of population with ambulatory disability in the United States with a correlation coefficient (R) of 0.622 and weighted average of 6.0%. Similarly, the statistical analysis conducted on geographies consisting of 469,824,822 people shows no correlation between the proportion of Africans and percentage of population with ambulatory disability in the United States with a correlation coefficient (R) of 0.034 and weighted average of 7.0%, a difference of 16.0%.
Ambulatory Disability Correlation Summary
| Measurement | Greek | African |
| Minimum | 1.5% | 1.5% |
| Maximum | 50.0% | 27.3% |
| Range | 48.5% | 25.7% |
| Mean | 11.2% | 9.7% |
| Median | 8.0% | 8.6% |
| Interquartile 25% (IQ1) | 5.6% | 7.3% |
| Interquartile 75% (IQ3) | 11.9% | 10.6% |
| Interquartile Range (IQR) | 6.3% | 3.4% |
| Standard Deviation (Sample) | 9.8% | 3.9% |
| Standard Deviation (Population) | 9.7% | 3.9% |
Similar Demographics by Ambulatory Disability
Demographics Similar to Greeks by Ambulatory Disability
In terms of ambulatory disability, the demographic groups most similar to Greeks are Immigrants from Austria (6.0%, a difference of 0.070%), Maltese (6.0%, a difference of 0.18%), Lithuanian (6.0%, a difference of 0.20%), Immigrants from Eastern Europe (6.0%, a difference of 0.21%), and Immigrants from Moldova (6.0%, a difference of 0.25%).
| Demographics | Rating | Rank | Ambulatory Disability |
| Macedonians | 82.8 /100 | #144 | Excellent 6.0% |
| Pakistanis | 82.5 /100 | #145 | Excellent 6.0% |
| Immigrants | Greece | 82.5 /100 | #146 | Excellent 6.0% |
| Immigrants | Moldova | 82.4 /100 | #147 | Excellent 6.0% |
| Immigrants | Eastern Europe | 82.0 /100 | #148 | Excellent 6.0% |
| Lithuanians | 81.9 /100 | #149 | Excellent 6.0% |
| Maltese | 81.6 /100 | #150 | Excellent 6.0% |
| Greeks | 79.6 /100 | #151 | Good 6.0% |
| Immigrants | Austria | 78.8 /100 | #152 | Good 6.0% |
| Syrians | 75.5 /100 | #153 | Good 6.0% |
| Immigrants | Croatia | 75.1 /100 | #154 | Good 6.0% |
| Immigrants | Scotland | 72.1 /100 | #155 | Good 6.0% |
| Northern Europeans | 71.8 /100 | #156 | Good 6.0% |
| Ghanaians | 71.3 /100 | #157 | Good 6.0% |
| Immigrants | Fiji | 71.2 /100 | #158 | Good 6.0% |
Demographics Similar to Africans by Ambulatory Disability
In terms of ambulatory disability, the demographic groups most similar to Africans are Immigrants from Armenia (7.0%, a difference of 0.060%), British West Indian (7.0%, a difference of 0.11%), Marshallese (6.9%, a difference of 0.34%), Puget Sound Salish (6.9%, a difference of 0.35%), and Immigrants from Cabo Verde (7.0%, a difference of 0.36%).
| Demographics | Rating | Rank | Ambulatory Disability |
| Alaskan Athabascans | 0.0 /100 | #296 | Tragic 6.9% |
| French American Indians | 0.0 /100 | #297 | Tragic 6.9% |
| Immigrants | Grenada | 0.0 /100 | #298 | Tragic 6.9% |
| Puget Sound Salish | 0.0 /100 | #299 | Tragic 6.9% |
| Marshallese | 0.0 /100 | #300 | Tragic 6.9% |
| British West Indians | 0.0 /100 | #301 | Tragic 7.0% |
| Immigrants | Armenia | 0.0 /100 | #302 | Tragic 7.0% |
| Africans | 0.0 /100 | #303 | Tragic 7.0% |
| Immigrants | Cabo Verde | 0.0 /100 | #304 | Tragic 7.0% |
| Immigrants | Micronesia | 0.0 /100 | #305 | Tragic 7.0% |
| Iroquois | 0.0 /100 | #306 | Tragic 7.1% |
| Spanish Americans | 0.0 /100 | #307 | Tragic 7.1% |
| Chippewa | 0.0 /100 | #308 | Tragic 7.1% |
| Immigrants | Azores | 0.0 /100 | #309 | Tragic 7.1% |
| Arapaho | 0.0 /100 | #310 | Tragic 7.1% |