Greek vs African Professional Degree
COMPARE
Greek
African
Professional Degree
Professional Degree Comparison
Greeks
Africans
5.3%
PROFESSIONAL DEGREE
99.6/ 100
METRIC RATING
86th/ 347
METRIC RANK
3.7%
PROFESSIONAL DEGREE
1.0/ 100
METRIC RATING
259th/ 347
METRIC RANK
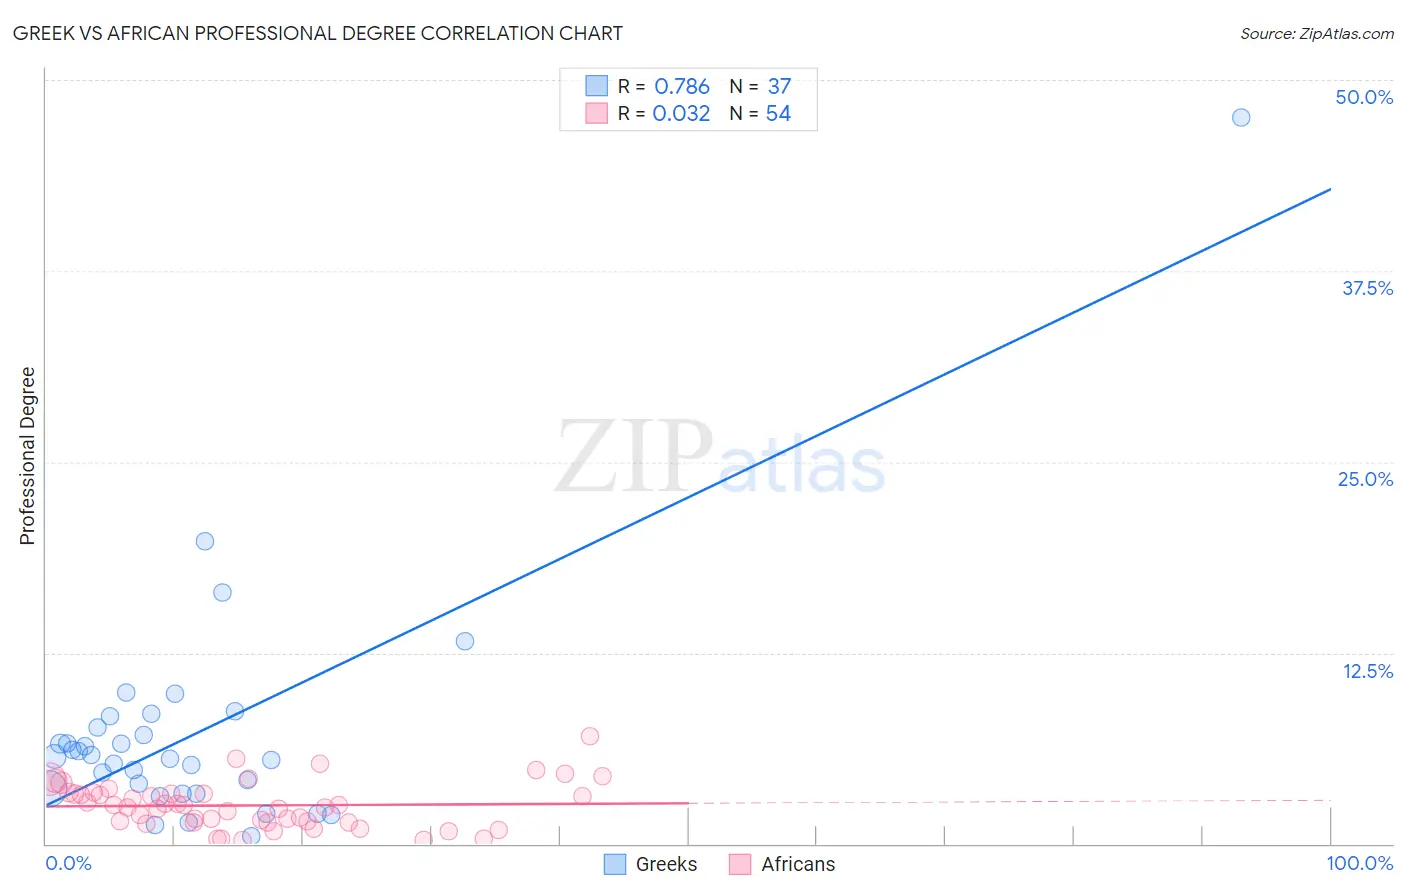
Greek vs African Professional Degree Correlation Chart
The statistical analysis conducted on geographies consisting of 480,768,816 people shows a strong positive correlation between the proportion of Greeks and percentage of population with at least professional degree education in the United States with a correlation coefficient (R) of 0.786 and weighted average of 5.3%. Similarly, the statistical analysis conducted on geographies consisting of 467,688,066 people shows no correlation between the proportion of Africans and percentage of population with at least professional degree education in the United States with a correlation coefficient (R) of 0.032 and weighted average of 3.7%, a difference of 43.6%.
Professional Degree Correlation Summary
| Measurement | Greek | African |
| Minimum | 0.52% | 0.23% |
| Maximum | 47.6% | 7.1% |
| Range | 47.0% | 6.8% |
| Mean | 7.2% | 2.5% |
| Median | 5.7% | 2.5% |
| Interquartile 25% (IQ1) | 3.4% | 1.4% |
| Interquartile 75% (IQ3) | 8.0% | 3.3% |
| Interquartile Range (IQR) | 4.6% | 1.9% |
| Standard Deviation (Sample) | 7.9% | 1.5% |
| Standard Deviation (Population) | 7.8% | 1.5% |
Similar Demographics by Professional Degree
Demographics Similar to Greeks by Professional Degree
In terms of professional degree, the demographic groups most similar to Greeks are Immigrants from Zimbabwe (5.3%, a difference of 0.0%), Carpatho Rusyn (5.3%, a difference of 0.020%), Immigrants from Croatia (5.3%, a difference of 0.020%), Immigrants from Chile (5.3%, a difference of 0.11%), and Romanian (5.3%, a difference of 0.23%).
| Demographics | Rating | Rank | Professional Degree |
| Immigrants | North America | 99.7 /100 | #79 | Exceptional 5.3% |
| Immigrants | England | 99.6 /100 | #80 | Exceptional 5.3% |
| Immigrants | Brazil | 99.6 /100 | #81 | Exceptional 5.3% |
| Romanians | 99.6 /100 | #82 | Exceptional 5.3% |
| Carpatho Rusyns | 99.6 /100 | #83 | Exceptional 5.3% |
| Immigrants | Croatia | 99.6 /100 | #84 | Exceptional 5.3% |
| Immigrants | Zimbabwe | 99.6 /100 | #85 | Exceptional 5.3% |
| Greeks | 99.6 /100 | #86 | Exceptional 5.3% |
| Immigrants | Chile | 99.5 /100 | #87 | Exceptional 5.3% |
| Egyptians | 99.5 /100 | #88 | Exceptional 5.3% |
| Chileans | 99.5 /100 | #89 | Exceptional 5.3% |
| Immigrants | Scotland | 99.5 /100 | #90 | Exceptional 5.3% |
| Laotians | 99.5 /100 | #91 | Exceptional 5.2% |
| Immigrants | Eastern Europe | 99.5 /100 | #92 | Exceptional 5.2% |
| Northern Europeans | 99.3 /100 | #93 | Exceptional 5.2% |
Demographics Similar to Africans by Professional Degree
In terms of professional degree, the demographic groups most similar to Africans are Indonesian (3.7%, a difference of 0.010%), Immigrants from Guyana (3.7%, a difference of 0.19%), U.S. Virgin Islander (3.7%, a difference of 0.20%), Immigrants from St. Vincent and the Grenadines (3.7%, a difference of 0.22%), and Bahamian (3.7%, a difference of 0.30%).
| Demographics | Rating | Rank | Professional Degree |
| Jamaicans | 1.4 /100 | #252 | Tragic 3.7% |
| Pueblo | 1.4 /100 | #253 | Tragic 3.7% |
| Tongans | 1.3 /100 | #254 | Tragic 3.7% |
| Osage | 1.2 /100 | #255 | Tragic 3.7% |
| Iroquois | 1.2 /100 | #256 | Tragic 3.7% |
| Bahamians | 1.1 /100 | #257 | Tragic 3.7% |
| Immigrants | St. Vincent and the Grenadines | 1.1 /100 | #258 | Tragic 3.7% |
| Africans | 1.0 /100 | #259 | Tragic 3.7% |
| Indonesians | 1.0 /100 | #260 | Tragic 3.7% |
| Immigrants | Guyana | 1.0 /100 | #261 | Tragic 3.7% |
| U.S. Virgin Islanders | 1.0 /100 | #262 | Tragic 3.7% |
| Hopi | 0.9 /100 | #263 | Tragic 3.6% |
| Immigrants | Cambodia | 0.9 /100 | #264 | Tragic 3.6% |
| Immigrants | Congo | 0.8 /100 | #265 | Tragic 3.6% |
| Central American Indians | 0.8 /100 | #266 | Tragic 3.6% |