Greek vs Venezuelan Ambulatory Disability
COMPARE
Greek
Venezuelan
Ambulatory Disability
Ambulatory Disability Comparison
Greeks
Venezuelans
6.0%
AMBULATORY DISABILITY
79.6/ 100
METRIC RATING
151st/ 347
METRIC RANK
5.5%
AMBULATORY DISABILITY
99.9/ 100
METRIC RATING
40th/ 347
METRIC RANK
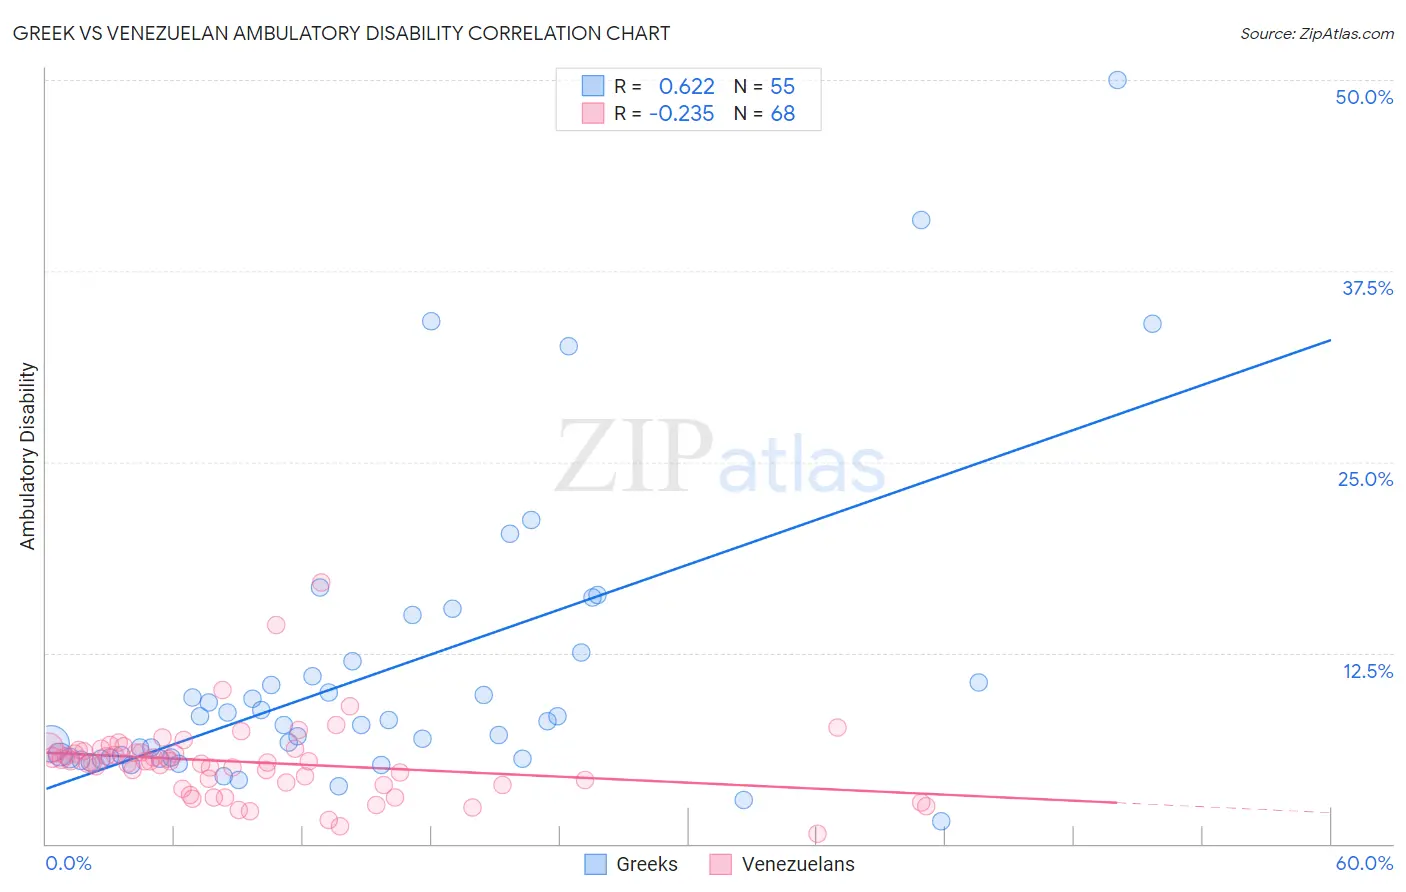
Greek vs Venezuelan Ambulatory Disability Correlation Chart
The statistical analysis conducted on geographies consisting of 482,531,888 people shows a significant positive correlation between the proportion of Greeks and percentage of population with ambulatory disability in the United States with a correlation coefficient (R) of 0.622 and weighted average of 6.0%. Similarly, the statistical analysis conducted on geographies consisting of 306,237,534 people shows a weak negative correlation between the proportion of Venezuelans and percentage of population with ambulatory disability in the United States with a correlation coefficient (R) of -0.235 and weighted average of 5.5%, a difference of 9.2%.
Ambulatory Disability Correlation Summary
| Measurement | Greek | Venezuelan |
| Minimum | 1.5% | 0.63% |
| Maximum | 50.0% | 17.1% |
| Range | 48.5% | 16.5% |
| Mean | 11.2% | 5.3% |
| Median | 8.0% | 5.4% |
| Interquartile 25% (IQ1) | 5.6% | 4.0% |
| Interquartile 75% (IQ3) | 11.9% | 6.1% |
| Interquartile Range (IQR) | 6.3% | 2.1% |
| Standard Deviation (Sample) | 9.8% | 2.6% |
| Standard Deviation (Population) | 9.7% | 2.5% |
Similar Demographics by Ambulatory Disability
Demographics Similar to Greeks by Ambulatory Disability
In terms of ambulatory disability, the demographic groups most similar to Greeks are Immigrants from Austria (6.0%, a difference of 0.070%), Maltese (6.0%, a difference of 0.18%), Lithuanian (6.0%, a difference of 0.20%), Immigrants from Eastern Europe (6.0%, a difference of 0.21%), and Immigrants from Moldova (6.0%, a difference of 0.25%).
| Demographics | Rating | Rank | Ambulatory Disability |
| Macedonians | 82.8 /100 | #144 | Excellent 6.0% |
| Pakistanis | 82.5 /100 | #145 | Excellent 6.0% |
| Immigrants | Greece | 82.5 /100 | #146 | Excellent 6.0% |
| Immigrants | Moldova | 82.4 /100 | #147 | Excellent 6.0% |
| Immigrants | Eastern Europe | 82.0 /100 | #148 | Excellent 6.0% |
| Lithuanians | 81.9 /100 | #149 | Excellent 6.0% |
| Maltese | 81.6 /100 | #150 | Excellent 6.0% |
| Greeks | 79.6 /100 | #151 | Good 6.0% |
| Immigrants | Austria | 78.8 /100 | #152 | Good 6.0% |
| Syrians | 75.5 /100 | #153 | Good 6.0% |
| Immigrants | Croatia | 75.1 /100 | #154 | Good 6.0% |
| Immigrants | Scotland | 72.1 /100 | #155 | Good 6.0% |
| Northern Europeans | 71.8 /100 | #156 | Good 6.0% |
| Ghanaians | 71.3 /100 | #157 | Good 6.0% |
| Immigrants | Fiji | 71.2 /100 | #158 | Good 6.0% |
Demographics Similar to Venezuelans by Ambulatory Disability
In terms of ambulatory disability, the demographic groups most similar to Venezuelans are Mongolian (5.5%, a difference of 0.080%), Argentinean (5.5%, a difference of 0.16%), Immigrants from Eritrea (5.5%, a difference of 0.34%), Turkish (5.5%, a difference of 0.43%), and Cypriot (5.5%, a difference of 0.43%).
| Demographics | Rating | Rank | Ambulatory Disability |
| Immigrants | Pakistan | 100.0 /100 | #33 | Exceptional 5.5% |
| Immigrants | Asia | 100.0 /100 | #34 | Exceptional 5.5% |
| Afghans | 100.0 /100 | #35 | Exceptional 5.5% |
| Immigrants | Malaysia | 100.0 /100 | #36 | Exceptional 5.5% |
| Turks | 100.0 /100 | #37 | Exceptional 5.5% |
| Cypriots | 100.0 /100 | #38 | Exceptional 5.5% |
| Immigrants | Eritrea | 100.0 /100 | #39 | Exceptional 5.5% |
| Venezuelans | 99.9 /100 | #40 | Exceptional 5.5% |
| Mongolians | 99.9 /100 | #41 | Exceptional 5.5% |
| Argentineans | 99.9 /100 | #42 | Exceptional 5.5% |
| Paraguayans | 99.9 /100 | #43 | Exceptional 5.5% |
| Immigrants | Indonesia | 99.9 /100 | #44 | Exceptional 5.5% |
| Immigrants | Sweden | 99.9 /100 | #45 | Exceptional 5.6% |
| Egyptians | 99.9 /100 | #46 | Exceptional 5.6% |
| Immigrants | Japan | 99.9 /100 | #47 | Exceptional 5.6% |