Greek vs Laotian Ambulatory Disability
COMPARE
Greek
Laotian
Ambulatory Disability
Ambulatory Disability Comparison
Greeks
Laotians
6.0%
AMBULATORY DISABILITY
79.6/ 100
METRIC RATING
151st/ 347
METRIC RANK
5.7%
AMBULATORY DISABILITY
99.7/ 100
METRIC RATING
64th/ 347
METRIC RANK
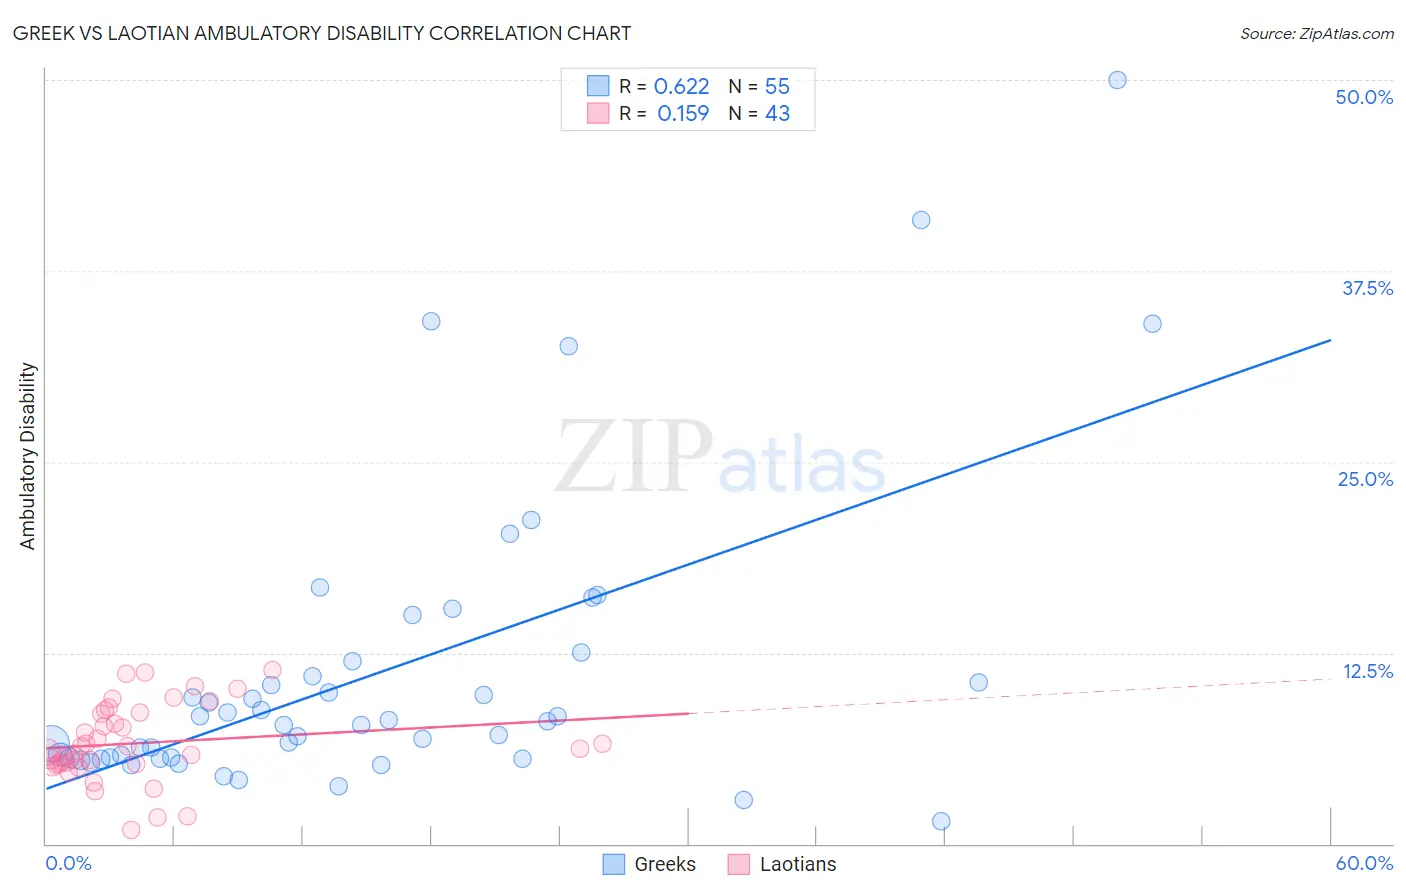
Greek vs Laotian Ambulatory Disability Correlation Chart
The statistical analysis conducted on geographies consisting of 482,531,888 people shows a significant positive correlation between the proportion of Greeks and percentage of population with ambulatory disability in the United States with a correlation coefficient (R) of 0.622 and weighted average of 6.0%. Similarly, the statistical analysis conducted on geographies consisting of 224,814,363 people shows a poor positive correlation between the proportion of Laotians and percentage of population with ambulatory disability in the United States with a correlation coefficient (R) of 0.159 and weighted average of 5.7%, a difference of 6.3%.
Ambulatory Disability Correlation Summary
| Measurement | Greek | Laotian |
| Minimum | 1.5% | 0.92% |
| Maximum | 50.0% | 11.4% |
| Range | 48.5% | 10.4% |
| Mean | 11.2% | 6.6% |
| Median | 8.0% | 6.2% |
| Interquartile 25% (IQ1) | 5.6% | 5.2% |
| Interquartile 75% (IQ3) | 11.9% | 8.6% |
| Interquartile Range (IQR) | 6.3% | 3.4% |
| Standard Deviation (Sample) | 9.8% | 2.5% |
| Standard Deviation (Population) | 9.7% | 2.5% |
Similar Demographics by Ambulatory Disability
Demographics Similar to Greeks by Ambulatory Disability
In terms of ambulatory disability, the demographic groups most similar to Greeks are Immigrants from Austria (6.0%, a difference of 0.070%), Maltese (6.0%, a difference of 0.18%), Lithuanian (6.0%, a difference of 0.20%), Immigrants from Eastern Europe (6.0%, a difference of 0.21%), and Immigrants from Moldova (6.0%, a difference of 0.25%).
| Demographics | Rating | Rank | Ambulatory Disability |
| Macedonians | 82.8 /100 | #144 | Excellent 6.0% |
| Pakistanis | 82.5 /100 | #145 | Excellent 6.0% |
| Immigrants | Greece | 82.5 /100 | #146 | Excellent 6.0% |
| Immigrants | Moldova | 82.4 /100 | #147 | Excellent 6.0% |
| Immigrants | Eastern Europe | 82.0 /100 | #148 | Excellent 6.0% |
| Lithuanians | 81.9 /100 | #149 | Excellent 6.0% |
| Maltese | 81.6 /100 | #150 | Excellent 6.0% |
| Greeks | 79.6 /100 | #151 | Good 6.0% |
| Immigrants | Austria | 78.8 /100 | #152 | Good 6.0% |
| Syrians | 75.5 /100 | #153 | Good 6.0% |
| Immigrants | Croatia | 75.1 /100 | #154 | Good 6.0% |
| Immigrants | Scotland | 72.1 /100 | #155 | Good 6.0% |
| Northern Europeans | 71.8 /100 | #156 | Good 6.0% |
| Ghanaians | 71.3 /100 | #157 | Good 6.0% |
| Immigrants | Fiji | 71.2 /100 | #158 | Good 6.0% |
Demographics Similar to Laotians by Ambulatory Disability
In terms of ambulatory disability, the demographic groups most similar to Laotians are Immigrants from Switzerland (5.7%, a difference of 0.030%), Israeli (5.7%, a difference of 0.12%), Immigrants from France (5.6%, a difference of 0.13%), Immigrants from Uganda (5.7%, a difference of 0.13%), and Sri Lankan (5.7%, a difference of 0.16%).
| Demographics | Rating | Rank | Ambulatory Disability |
| Immigrants | Brazil | 99.8 /100 | #57 | Exceptional 5.6% |
| Immigrants | Zimbabwe | 99.8 /100 | #58 | Exceptional 5.6% |
| Immigrants | Afghanistan | 99.8 /100 | #59 | Exceptional 5.6% |
| Immigrants | Lithuania | 99.8 /100 | #60 | Exceptional 5.6% |
| Immigrants | Belgium | 99.7 /100 | #61 | Exceptional 5.6% |
| Immigrants | Spain | 99.7 /100 | #62 | Exceptional 5.6% |
| Immigrants | France | 99.7 /100 | #63 | Exceptional 5.6% |
| Laotians | 99.7 /100 | #64 | Exceptional 5.7% |
| Immigrants | Switzerland | 99.7 /100 | #65 | Exceptional 5.7% |
| Israelis | 99.6 /100 | #66 | Exceptional 5.7% |
| Immigrants | Uganda | 99.6 /100 | #67 | Exceptional 5.7% |
| Sri Lankans | 99.6 /100 | #68 | Exceptional 5.7% |
| Peruvians | 99.5 /100 | #69 | Exceptional 5.7% |
| Sierra Leoneans | 99.4 /100 | #70 | Exceptional 5.7% |
| Immigrants | Peru | 99.4 /100 | #71 | Exceptional 5.7% |