European vs African Ambulatory Disability
COMPARE
European
African
Ambulatory Disability
Ambulatory Disability Comparison
Europeans
Africans
6.2%
AMBULATORY DISABILITY
36.2/ 100
METRIC RATING
186th/ 347
METRIC RANK
7.0%
AMBULATORY DISABILITY
0.0/ 100
METRIC RATING
303rd/ 347
METRIC RANK
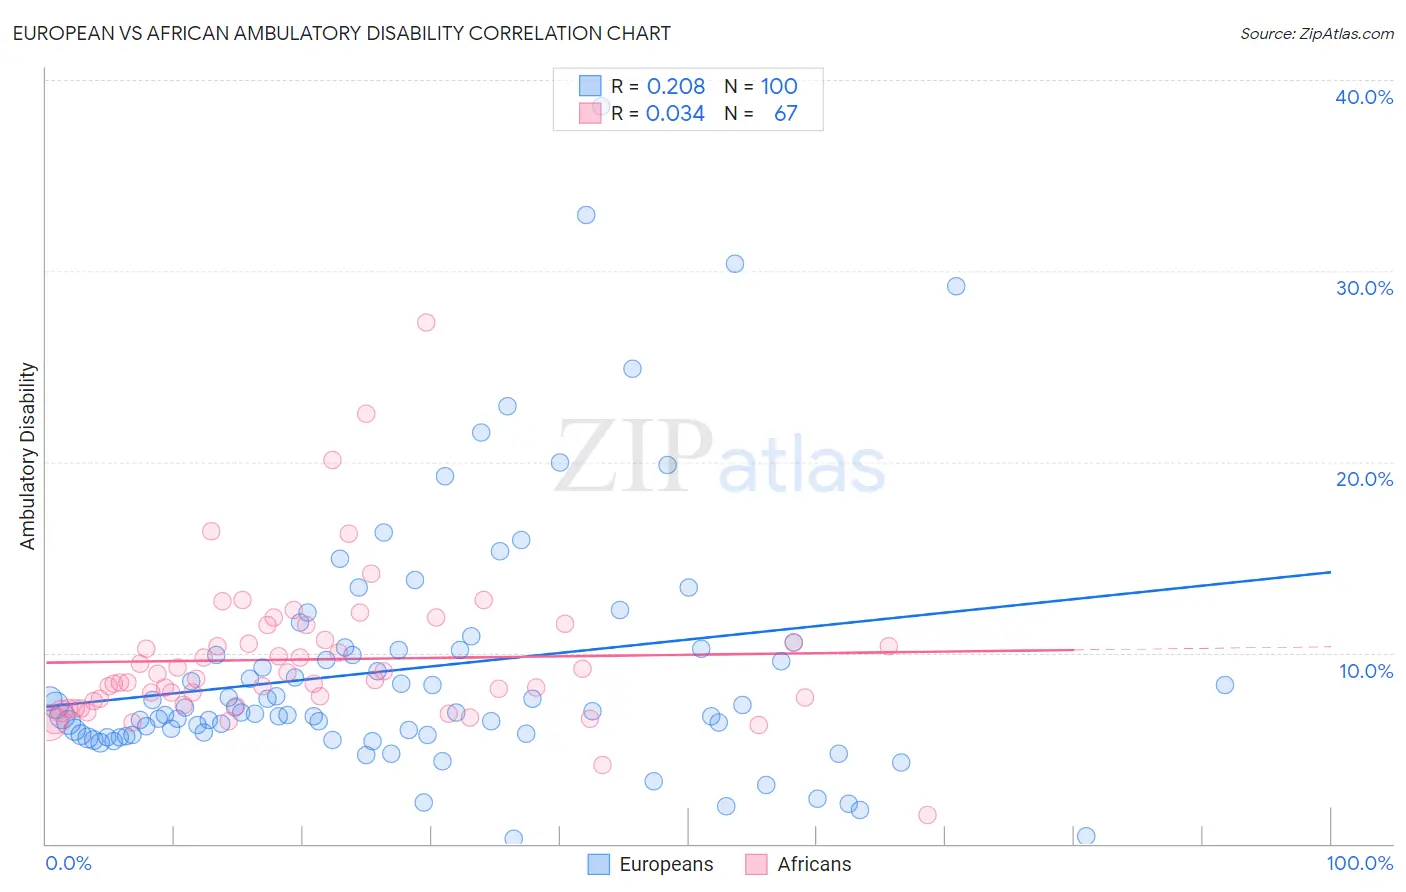
European vs African Ambulatory Disability Correlation Chart
The statistical analysis conducted on geographies consisting of 561,341,631 people shows a weak positive correlation between the proportion of Europeans and percentage of population with ambulatory disability in the United States with a correlation coefficient (R) of 0.208 and weighted average of 6.2%. Similarly, the statistical analysis conducted on geographies consisting of 469,824,822 people shows no correlation between the proportion of Africans and percentage of population with ambulatory disability in the United States with a correlation coefficient (R) of 0.034 and weighted average of 7.0%, a difference of 13.1%.
Ambulatory Disability Correlation Summary
| Measurement | European | African |
| Minimum | 0.26% | 1.5% |
| Maximum | 38.6% | 27.3% |
| Range | 38.4% | 25.7% |
| Mean | 9.2% | 9.7% |
| Median | 6.9% | 8.6% |
| Interquartile 25% (IQ1) | 5.7% | 7.3% |
| Interquartile 75% (IQ3) | 10.2% | 10.6% |
| Interquartile Range (IQR) | 4.5% | 3.4% |
| Standard Deviation (Sample) | 6.7% | 3.9% |
| Standard Deviation (Population) | 6.7% | 3.9% |
Similar Demographics by Ambulatory Disability
Demographics Similar to Europeans by Ambulatory Disability
In terms of ambulatory disability, the demographic groups most similar to Europeans are Carpatho Rusyn (6.2%, a difference of 0.050%), Immigrants from Bosnia and Herzegovina (6.2%, a difference of 0.060%), British (6.2%, a difference of 0.11%), Ukrainian (6.2%, a difference of 0.13%), and Immigrants from Western Africa (6.2%, a difference of 0.17%).
| Demographics | Rating | Rank | Ambulatory Disability |
| Austrians | 44.1 /100 | #179 | Average 6.1% |
| Immigrants | Nicaragua | 43.9 /100 | #180 | Average 6.1% |
| Swiss | 43.1 /100 | #181 | Average 6.1% |
| Serbians | 42.8 /100 | #182 | Average 6.1% |
| Immigrants | Thailand | 42.2 /100 | #183 | Average 6.1% |
| Immigrants | Ghana | 41.2 /100 | #184 | Average 6.1% |
| Immigrants | Bosnia and Herzegovina | 37.2 /100 | #185 | Fair 6.2% |
| Europeans | 36.2 /100 | #186 | Fair 6.2% |
| Carpatho Rusyns | 35.3 /100 | #187 | Fair 6.2% |
| British | 34.3 /100 | #188 | Fair 6.2% |
| Ukrainians | 34.0 /100 | #189 | Fair 6.2% |
| Immigrants | Western Africa | 33.4 /100 | #190 | Fair 6.2% |
| Immigrants | Guatemala | 31.9 /100 | #191 | Fair 6.2% |
| Immigrants | Western Europe | 31.6 /100 | #192 | Fair 6.2% |
| Guatemalans | 30.0 /100 | #193 | Fair 6.2% |
Demographics Similar to Africans by Ambulatory Disability
In terms of ambulatory disability, the demographic groups most similar to Africans are Immigrants from Armenia (7.0%, a difference of 0.060%), British West Indian (7.0%, a difference of 0.11%), Marshallese (6.9%, a difference of 0.34%), Puget Sound Salish (6.9%, a difference of 0.35%), and Immigrants from Cabo Verde (7.0%, a difference of 0.36%).
| Demographics | Rating | Rank | Ambulatory Disability |
| Alaskan Athabascans | 0.0 /100 | #296 | Tragic 6.9% |
| French American Indians | 0.0 /100 | #297 | Tragic 6.9% |
| Immigrants | Grenada | 0.0 /100 | #298 | Tragic 6.9% |
| Puget Sound Salish | 0.0 /100 | #299 | Tragic 6.9% |
| Marshallese | 0.0 /100 | #300 | Tragic 6.9% |
| British West Indians | 0.0 /100 | #301 | Tragic 7.0% |
| Immigrants | Armenia | 0.0 /100 | #302 | Tragic 7.0% |
| Africans | 0.0 /100 | #303 | Tragic 7.0% |
| Immigrants | Cabo Verde | 0.0 /100 | #304 | Tragic 7.0% |
| Immigrants | Micronesia | 0.0 /100 | #305 | Tragic 7.0% |
| Iroquois | 0.0 /100 | #306 | Tragic 7.1% |
| Spanish Americans | 0.0 /100 | #307 | Tragic 7.1% |
| Chippewa | 0.0 /100 | #308 | Tragic 7.1% |
| Immigrants | Azores | 0.0 /100 | #309 | Tragic 7.1% |
| Arapaho | 0.0 /100 | #310 | Tragic 7.1% |