Lebanese vs African Ambulatory Disability
COMPARE
Lebanese
African
Ambulatory Disability
Ambulatory Disability Comparison
Lebanese
Africans
6.1%
AMBULATORY DISABILITY
66.2/ 100
METRIC RATING
163rd/ 347
METRIC RANK
7.0%
AMBULATORY DISABILITY
0.0/ 100
METRIC RATING
303rd/ 347
METRIC RANK
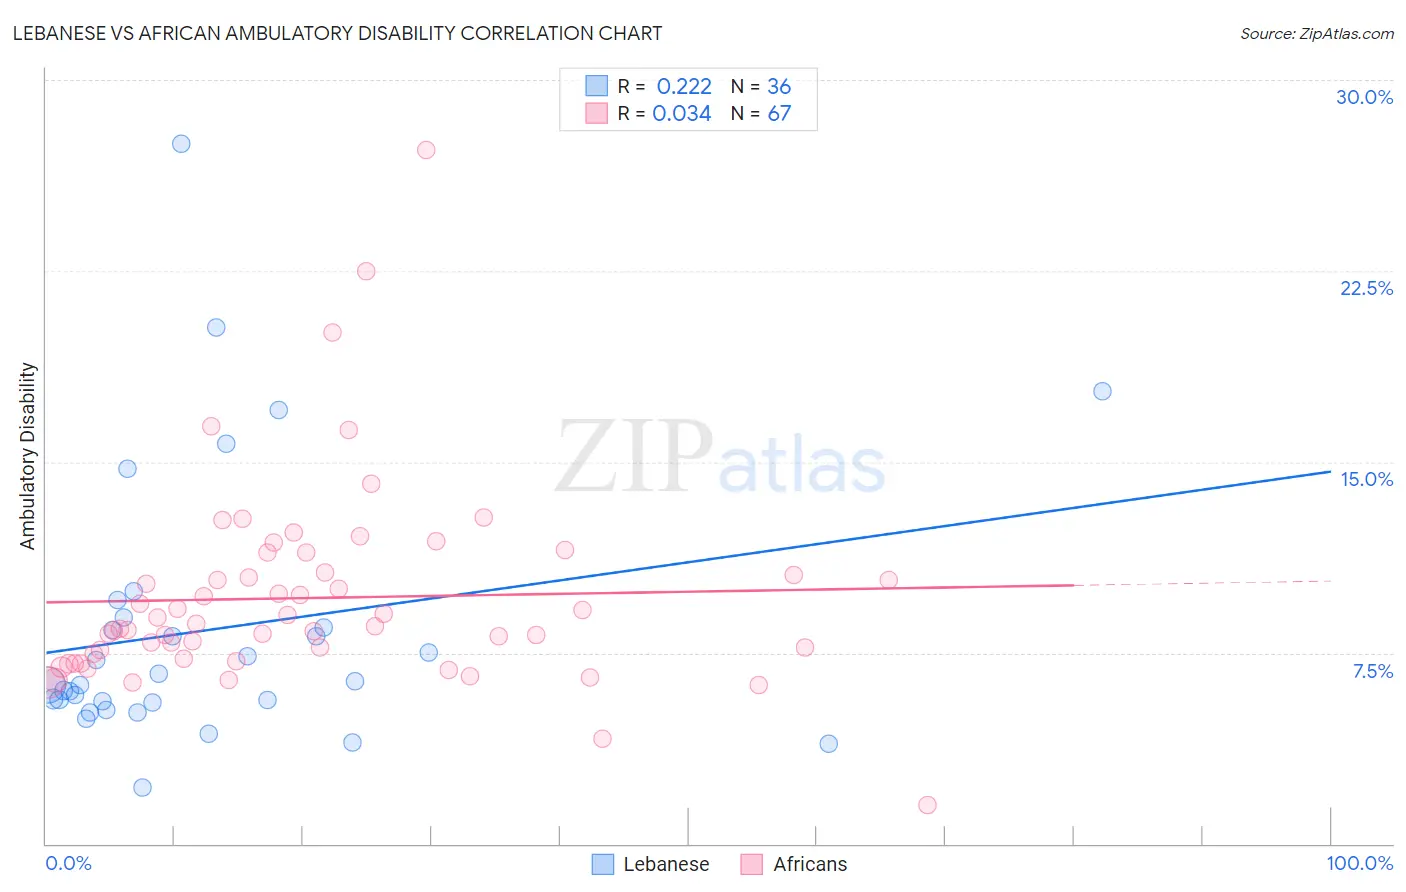
Lebanese vs African Ambulatory Disability Correlation Chart
The statistical analysis conducted on geographies consisting of 401,495,735 people shows a weak positive correlation between the proportion of Lebanese and percentage of population with ambulatory disability in the United States with a correlation coefficient (R) of 0.222 and weighted average of 6.1%. Similarly, the statistical analysis conducted on geographies consisting of 469,824,822 people shows no correlation between the proportion of Africans and percentage of population with ambulatory disability in the United States with a correlation coefficient (R) of 0.034 and weighted average of 7.0%, a difference of 15.0%.
Ambulatory Disability Correlation Summary
| Measurement | Lebanese | African |
| Minimum | 2.2% | 1.5% |
| Maximum | 27.5% | 27.3% |
| Range | 25.3% | 25.7% |
| Mean | 8.4% | 9.7% |
| Median | 6.3% | 8.6% |
| Interquartile 25% (IQ1) | 5.6% | 7.3% |
| Interquartile 75% (IQ3) | 8.7% | 10.6% |
| Interquartile Range (IQR) | 3.1% | 3.4% |
| Standard Deviation (Sample) | 5.3% | 3.9% |
| Standard Deviation (Population) | 5.2% | 3.9% |
Similar Demographics by Ambulatory Disability
Demographics Similar to Lebanese by Ambulatory Disability
In terms of ambulatory disability, the demographic groups most similar to Lebanese are Nigerian (6.1%, a difference of 0.050%), Basque (6.1%, a difference of 0.15%), Immigrants from Belarus (6.1%, a difference of 0.18%), Nicaraguan (6.1%, a difference of 0.18%), and Iraqi (6.1%, a difference of 0.20%).
| Demographics | Rating | Rank | Ambulatory Disability |
| Northern Europeans | 71.8 /100 | #156 | Good 6.0% |
| Ghanaians | 71.3 /100 | #157 | Good 6.0% |
| Immigrants | Fiji | 71.2 /100 | #158 | Good 6.0% |
| Immigrants | Latvia | 71.1 /100 | #159 | Good 6.0% |
| Central Americans | 69.8 /100 | #160 | Good 6.0% |
| Immigrants | Belarus | 69.2 /100 | #161 | Good 6.1% |
| Nigerians | 67.1 /100 | #162 | Good 6.1% |
| Lebanese | 66.2 /100 | #163 | Good 6.1% |
| Basques | 63.7 /100 | #164 | Good 6.1% |
| Nicaraguans | 63.2 /100 | #165 | Good 6.1% |
| Iraqis | 62.8 /100 | #166 | Good 6.1% |
| Immigrants | Oceania | 60.7 /100 | #167 | Good 6.1% |
| Ecuadorians | 60.5 /100 | #168 | Good 6.1% |
| Immigrants | Southern Europe | 58.1 /100 | #169 | Average 6.1% |
| Immigrants | Ecuador | 53.8 /100 | #170 | Average 6.1% |
Demographics Similar to Africans by Ambulatory Disability
In terms of ambulatory disability, the demographic groups most similar to Africans are Immigrants from Armenia (7.0%, a difference of 0.060%), British West Indian (7.0%, a difference of 0.11%), Marshallese (6.9%, a difference of 0.34%), Puget Sound Salish (6.9%, a difference of 0.35%), and Immigrants from Cabo Verde (7.0%, a difference of 0.36%).
| Demographics | Rating | Rank | Ambulatory Disability |
| Alaskan Athabascans | 0.0 /100 | #296 | Tragic 6.9% |
| French American Indians | 0.0 /100 | #297 | Tragic 6.9% |
| Immigrants | Grenada | 0.0 /100 | #298 | Tragic 6.9% |
| Puget Sound Salish | 0.0 /100 | #299 | Tragic 6.9% |
| Marshallese | 0.0 /100 | #300 | Tragic 6.9% |
| British West Indians | 0.0 /100 | #301 | Tragic 7.0% |
| Immigrants | Armenia | 0.0 /100 | #302 | Tragic 7.0% |
| Africans | 0.0 /100 | #303 | Tragic 7.0% |
| Immigrants | Cabo Verde | 0.0 /100 | #304 | Tragic 7.0% |
| Immigrants | Micronesia | 0.0 /100 | #305 | Tragic 7.0% |
| Iroquois | 0.0 /100 | #306 | Tragic 7.1% |
| Spanish Americans | 0.0 /100 | #307 | Tragic 7.1% |
| Chippewa | 0.0 /100 | #308 | Tragic 7.1% |
| Immigrants | Azores | 0.0 /100 | #309 | Tragic 7.1% |
| Arapaho | 0.0 /100 | #310 | Tragic 7.1% |