Hawaiian vs African Ambulatory Disability
COMPARE
Hawaiian
African
Ambulatory Disability
Ambulatory Disability Comparison
Hawaiians
Africans
6.5%
AMBULATORY DISABILITY
0.9/ 100
METRIC RATING
251st/ 347
METRIC RANK
7.0%
AMBULATORY DISABILITY
0.0/ 100
METRIC RATING
303rd/ 347
METRIC RANK
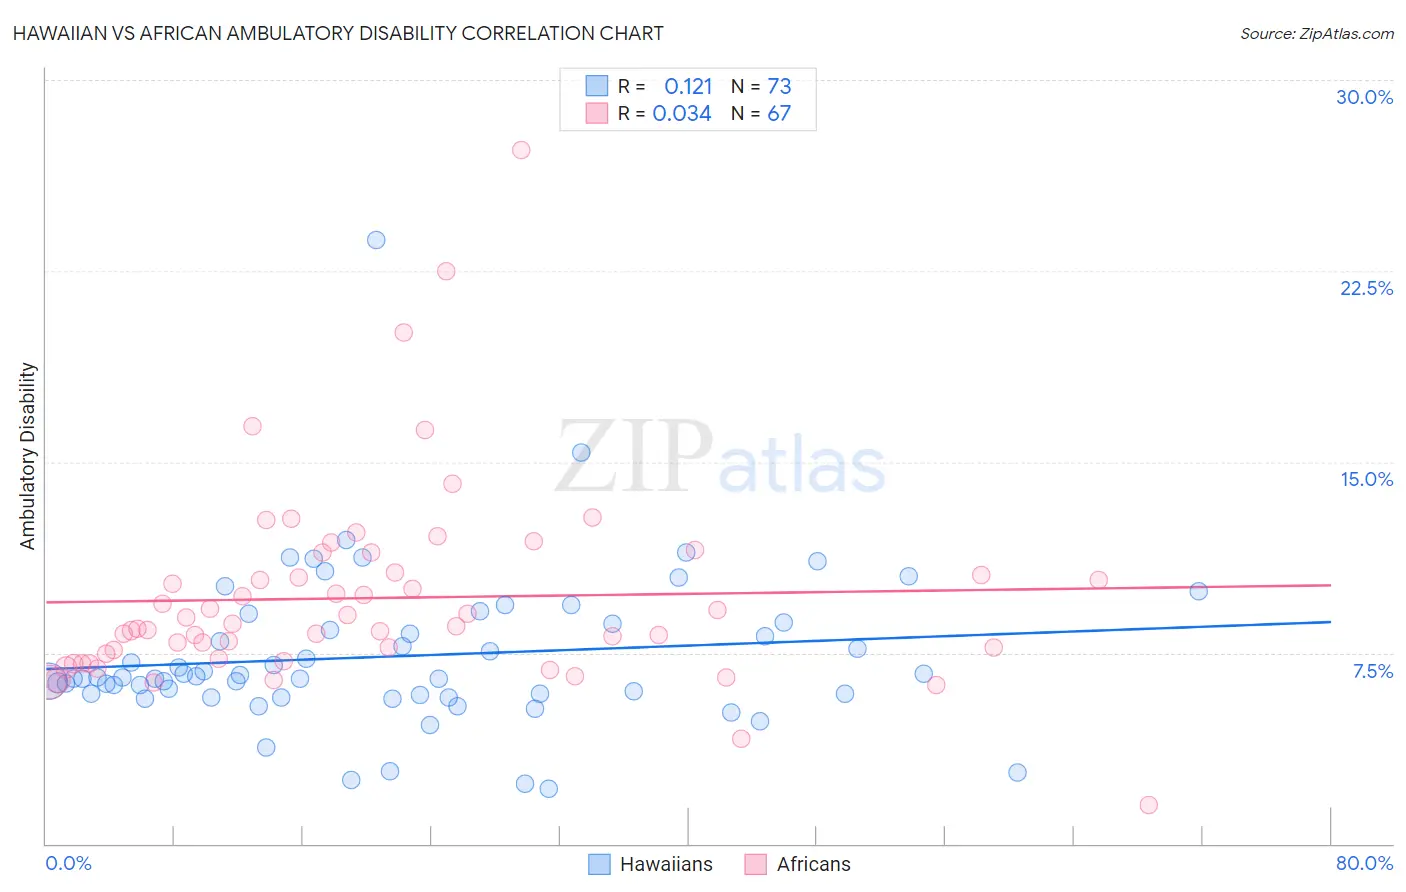
Hawaiian vs African Ambulatory Disability Correlation Chart
The statistical analysis conducted on geographies consisting of 327,430,219 people shows a poor positive correlation between the proportion of Hawaiians and percentage of population with ambulatory disability in the United States with a correlation coefficient (R) of 0.121 and weighted average of 6.5%. Similarly, the statistical analysis conducted on geographies consisting of 469,824,822 people shows no correlation between the proportion of Africans and percentage of population with ambulatory disability in the United States with a correlation coefficient (R) of 0.034 and weighted average of 7.0%, a difference of 7.3%.
Ambulatory Disability Correlation Summary
| Measurement | Hawaiian | African |
| Minimum | 2.1% | 1.5% |
| Maximum | 23.7% | 27.3% |
| Range | 21.6% | 25.7% |
| Mean | 7.4% | 9.7% |
| Median | 6.5% | 8.6% |
| Interquartile 25% (IQ1) | 5.9% | 7.3% |
| Interquartile 75% (IQ3) | 8.7% | 10.6% |
| Interquartile Range (IQR) | 2.8% | 3.4% |
| Standard Deviation (Sample) | 3.1% | 3.9% |
| Standard Deviation (Population) | 3.1% | 3.9% |
Similar Demographics by Ambulatory Disability
Demographics Similar to Hawaiians by Ambulatory Disability
In terms of ambulatory disability, the demographic groups most similar to Hawaiians are Chinese (6.5%, a difference of 0.18%), Immigrants from Bahamas (6.5%, a difference of 0.20%), Scottish (6.5%, a difference of 0.25%), Native Hawaiian (6.5%, a difference of 0.26%), and Belizean (6.5%, a difference of 0.41%).
| Demographics | Rating | Rank | Ambulatory Disability |
| Immigrants | Panama | 1.5 /100 | #244 | Tragic 6.5% |
| Tlingit-Haida | 1.5 /100 | #245 | Tragic 6.5% |
| Armenians | 1.5 /100 | #246 | Tragic 6.5% |
| Immigrants | Cuba | 1.4 /100 | #247 | Tragic 6.5% |
| Immigrants | Portugal | 1.4 /100 | #248 | Tragic 6.5% |
| Native Hawaiians | 1.1 /100 | #249 | Tragic 6.5% |
| Chinese | 1.0 /100 | #250 | Tragic 6.5% |
| Hawaiians | 0.9 /100 | #251 | Tragic 6.5% |
| Immigrants | Bahamas | 0.8 /100 | #252 | Tragic 6.5% |
| Scottish | 0.7 /100 | #253 | Tragic 6.5% |
| Belizeans | 0.7 /100 | #254 | Tragic 6.5% |
| Welsh | 0.6 /100 | #255 | Tragic 6.5% |
| Immigrants | Uzbekistan | 0.6 /100 | #256 | Tragic 6.5% |
| Bermudans | 0.5 /100 | #257 | Tragic 6.5% |
| Spanish American Indians | 0.5 /100 | #258 | Tragic 6.5% |
Demographics Similar to Africans by Ambulatory Disability
In terms of ambulatory disability, the demographic groups most similar to Africans are Immigrants from Armenia (7.0%, a difference of 0.060%), British West Indian (7.0%, a difference of 0.11%), Marshallese (6.9%, a difference of 0.34%), Puget Sound Salish (6.9%, a difference of 0.35%), and Immigrants from Cabo Verde (7.0%, a difference of 0.36%).
| Demographics | Rating | Rank | Ambulatory Disability |
| Alaskan Athabascans | 0.0 /100 | #296 | Tragic 6.9% |
| French American Indians | 0.0 /100 | #297 | Tragic 6.9% |
| Immigrants | Grenada | 0.0 /100 | #298 | Tragic 6.9% |
| Puget Sound Salish | 0.0 /100 | #299 | Tragic 6.9% |
| Marshallese | 0.0 /100 | #300 | Tragic 6.9% |
| British West Indians | 0.0 /100 | #301 | Tragic 7.0% |
| Immigrants | Armenia | 0.0 /100 | #302 | Tragic 7.0% |
| Africans | 0.0 /100 | #303 | Tragic 7.0% |
| Immigrants | Cabo Verde | 0.0 /100 | #304 | Tragic 7.0% |
| Immigrants | Micronesia | 0.0 /100 | #305 | Tragic 7.0% |
| Iroquois | 0.0 /100 | #306 | Tragic 7.1% |
| Spanish Americans | 0.0 /100 | #307 | Tragic 7.1% |
| Chippewa | 0.0 /100 | #308 | Tragic 7.1% |
| Immigrants | Azores | 0.0 /100 | #309 | Tragic 7.1% |
| Arapaho | 0.0 /100 | #310 | Tragic 7.1% |