Greek vs African 2nd Grade
COMPARE
Greek
African
2nd Grade
2nd Grade Comparison
Greeks
Africans
98.3%
2ND GRADE
99.8/ 100
METRIC RATING
62nd/ 347
METRIC RANK
97.7%
2ND GRADE
15.6/ 100
METRIC RATING
207th/ 347
METRIC RANK
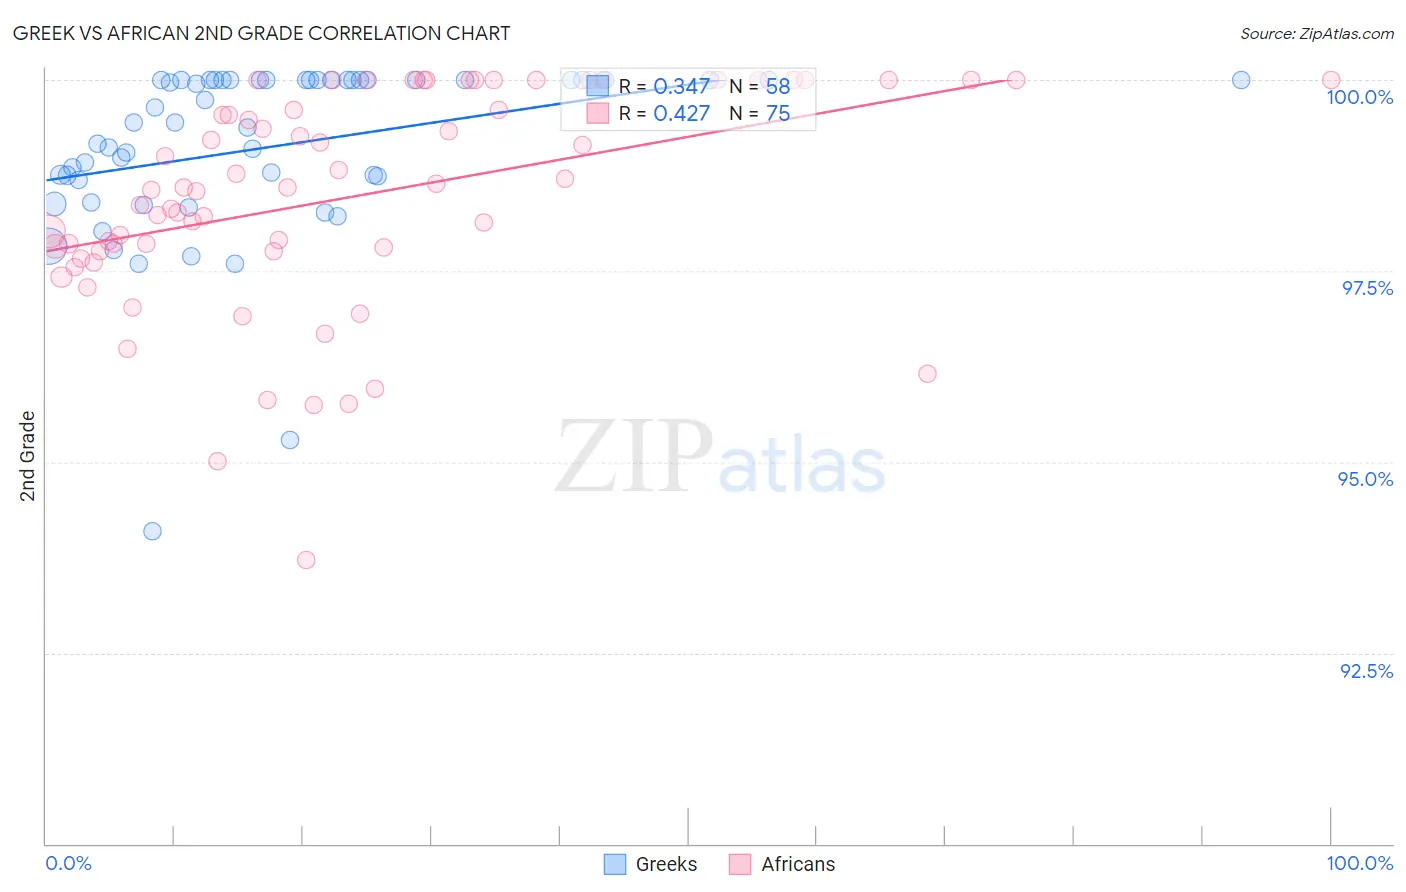
Greek vs African 2nd Grade Correlation Chart
The statistical analysis conducted on geographies consisting of 482,775,358 people shows a mild positive correlation between the proportion of Greeks and percentage of population with at least 2nd grade education in the United States with a correlation coefficient (R) of 0.347 and weighted average of 98.3%. Similarly, the statistical analysis conducted on geographies consisting of 470,094,148 people shows a moderate positive correlation between the proportion of Africans and percentage of population with at least 2nd grade education in the United States with a correlation coefficient (R) of 0.427 and weighted average of 97.7%, a difference of 0.61%.
2nd Grade Correlation Summary
| Measurement | Greek | African |
| Minimum | 94.1% | 93.7% |
| Maximum | 100.0% | 100.0% |
| Range | 5.9% | 6.3% |
| Mean | 99.1% | 98.5% |
| Median | 99.4% | 98.6% |
| Interquartile 25% (IQ1) | 98.7% | 97.8% |
| Interquartile 75% (IQ3) | 100.0% | 100.0% |
| Interquartile Range (IQR) | 1.3% | 2.2% |
| Standard Deviation (Sample) | 1.2% | 1.4% |
| Standard Deviation (Population) | 1.2% | 1.4% |
Similar Demographics by 2nd Grade
Demographics Similar to Greeks by 2nd Grade
In terms of 2nd grade, the demographic groups most similar to Greeks are Slavic (98.3%, a difference of 0.0%), Creek (98.3%, a difference of 0.0%), Immigrants from Canada (98.3%, a difference of 0.0%), Maltese (98.3%, a difference of 0.0%), and Immigrants from North America (98.3%, a difference of 0.0%).
| Demographics | Rating | Rank | 2nd Grade |
| Immigrants | Scotland | 99.8 /100 | #55 | Exceptional 98.3% |
| Americans | 99.8 /100 | #56 | Exceptional 98.3% |
| Austrians | 99.8 /100 | #57 | Exceptional 98.3% |
| Bulgarians | 99.8 /100 | #58 | Exceptional 98.3% |
| Slavs | 99.8 /100 | #59 | Exceptional 98.3% |
| Creek | 99.8 /100 | #60 | Exceptional 98.3% |
| Immigrants | Canada | 99.8 /100 | #61 | Exceptional 98.3% |
| Greeks | 99.8 /100 | #62 | Exceptional 98.3% |
| Maltese | 99.7 /100 | #63 | Exceptional 98.3% |
| Immigrants | North America | 99.7 /100 | #64 | Exceptional 98.3% |
| New Zealanders | 99.7 /100 | #65 | Exceptional 98.3% |
| Canadians | 99.7 /100 | #66 | Exceptional 98.3% |
| Immigrants | Northern Europe | 99.7 /100 | #67 | Exceptional 98.3% |
| Russians | 99.7 /100 | #68 | Exceptional 98.3% |
| Immigrants | Austria | 99.6 /100 | #69 | Exceptional 98.3% |
Demographics Similar to Africans by 2nd Grade
In terms of 2nd grade, the demographic groups most similar to Africans are Immigrants from Southern Europe (97.8%, a difference of 0.010%), Immigrants from Chile (97.7%, a difference of 0.010%), Yuman (97.8%, a difference of 0.020%), Immigrants from Albania (97.8%, a difference of 0.020%), and Immigrants from Northern Africa (97.7%, a difference of 0.020%).
| Demographics | Rating | Rank | 2nd Grade |
| Immigrants | Lebanon | 20.9 /100 | #200 | Fair 97.8% |
| Tohono O'odham | 20.9 /100 | #201 | Fair 97.8% |
| Immigrants | Ukraine | 20.5 /100 | #202 | Fair 97.8% |
| Yuman | 20.0 /100 | #203 | Fair 97.8% |
| Immigrants | Albania | 18.4 /100 | #204 | Poor 97.8% |
| Immigrants | Southern Europe | 18.1 /100 | #205 | Poor 97.8% |
| Immigrants | Chile | 17.3 /100 | #206 | Poor 97.7% |
| Africans | 15.6 /100 | #207 | Poor 97.7% |
| Immigrants | Northern Africa | 12.3 /100 | #208 | Poor 97.7% |
| Immigrants | Oceania | 10.9 /100 | #209 | Poor 97.7% |
| Costa Ricans | 10.5 /100 | #210 | Poor 97.7% |
| Laotians | 9.9 /100 | #211 | Tragic 97.7% |
| Immigrants | Bahamas | 8.4 /100 | #212 | Tragic 97.7% |
| Moroccans | 8.2 /100 | #213 | Tragic 97.7% |
| Samoans | 7.1 /100 | #214 | Tragic 97.7% |