Greek vs Immigrants from Liberia Ambulatory Disability
COMPARE
Greek
Immigrants from Liberia
Ambulatory Disability
Ambulatory Disability Comparison
Greeks
Immigrants from Liberia
6.0%
AMBULATORY DISABILITY
79.6/ 100
METRIC RATING
151st/ 347
METRIC RANK
6.4%
AMBULATORY DISABILITY
2.3/ 100
METRIC RATING
234th/ 347
METRIC RANK
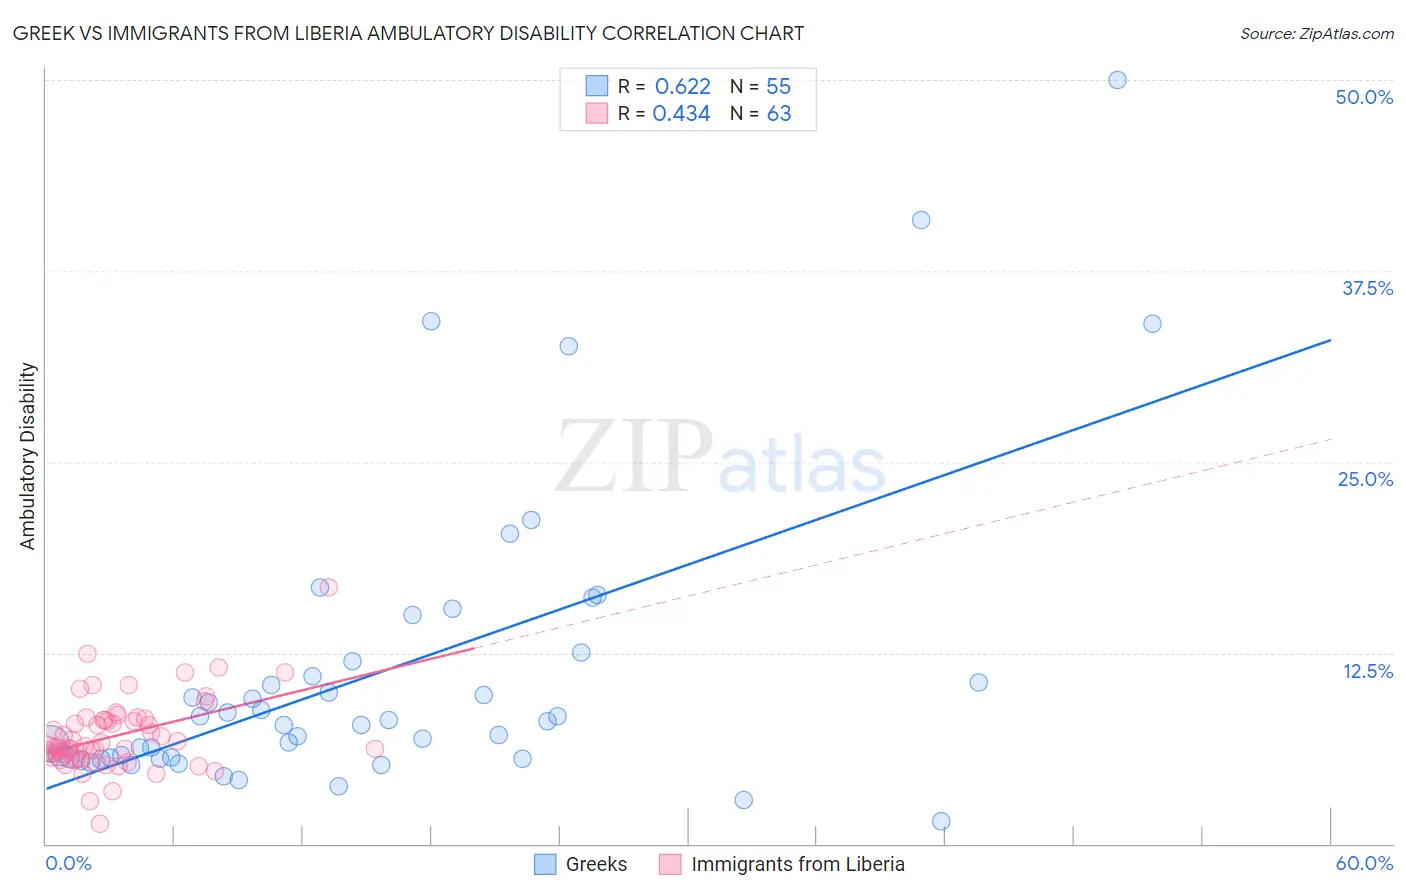
Greek vs Immigrants from Liberia Ambulatory Disability Correlation Chart
The statistical analysis conducted on geographies consisting of 482,531,888 people shows a significant positive correlation between the proportion of Greeks and percentage of population with ambulatory disability in the United States with a correlation coefficient (R) of 0.622 and weighted average of 6.0%. Similarly, the statistical analysis conducted on geographies consisting of 135,254,845 people shows a moderate positive correlation between the proportion of Immigrants from Liberia and percentage of population with ambulatory disability in the United States with a correlation coefficient (R) of 0.434 and weighted average of 6.4%, a difference of 6.9%.
Ambulatory Disability Correlation Summary
| Measurement | Greek | Immigrants from Liberia |
| Minimum | 1.5% | 1.3% |
| Maximum | 50.0% | 16.8% |
| Range | 48.5% | 15.5% |
| Mean | 11.2% | 7.1% |
| Median | 8.0% | 6.3% |
| Interquartile 25% (IQ1) | 5.6% | 5.6% |
| Interquartile 75% (IQ3) | 11.9% | 8.1% |
| Interquartile Range (IQR) | 6.3% | 2.5% |
| Standard Deviation (Sample) | 9.8% | 2.4% |
| Standard Deviation (Population) | 9.7% | 2.4% |
Similar Demographics by Ambulatory Disability
Demographics Similar to Greeks by Ambulatory Disability
In terms of ambulatory disability, the demographic groups most similar to Greeks are Immigrants from Austria (6.0%, a difference of 0.070%), Maltese (6.0%, a difference of 0.18%), Lithuanian (6.0%, a difference of 0.20%), Immigrants from Eastern Europe (6.0%, a difference of 0.21%), and Immigrants from Moldova (6.0%, a difference of 0.25%).
| Demographics | Rating | Rank | Ambulatory Disability |
| Macedonians | 82.8 /100 | #144 | Excellent 6.0% |
| Pakistanis | 82.5 /100 | #145 | Excellent 6.0% |
| Immigrants | Greece | 82.5 /100 | #146 | Excellent 6.0% |
| Immigrants | Moldova | 82.4 /100 | #147 | Excellent 6.0% |
| Immigrants | Eastern Europe | 82.0 /100 | #148 | Excellent 6.0% |
| Lithuanians | 81.9 /100 | #149 | Excellent 6.0% |
| Maltese | 81.6 /100 | #150 | Excellent 6.0% |
| Greeks | 79.6 /100 | #151 | Good 6.0% |
| Immigrants | Austria | 78.8 /100 | #152 | Good 6.0% |
| Syrians | 75.5 /100 | #153 | Good 6.0% |
| Immigrants | Croatia | 75.1 /100 | #154 | Good 6.0% |
| Immigrants | Scotland | 72.1 /100 | #155 | Good 6.0% |
| Northern Europeans | 71.8 /100 | #156 | Good 6.0% |
| Ghanaians | 71.3 /100 | #157 | Good 6.0% |
| Immigrants | Fiji | 71.2 /100 | #158 | Good 6.0% |
Demographics Similar to Immigrants from Liberia by Ambulatory Disability
In terms of ambulatory disability, the demographic groups most similar to Immigrants from Liberia are Subsaharan African (6.4%, a difference of 0.030%), Hispanic or Latino (6.4%, a difference of 0.030%), Assyrian/Chaldean/Syriac (6.4%, a difference of 0.090%), Dutch (6.4%, a difference of 0.18%), and Immigrants from Germany (6.4%, a difference of 0.27%).
| Demographics | Rating | Rank | Ambulatory Disability |
| Cubans | 4.0 /100 | #227 | Tragic 6.4% |
| Portuguese | 4.0 /100 | #228 | Tragic 6.4% |
| Czechoslovakians | 3.8 /100 | #229 | Tragic 6.4% |
| Mexicans | 3.5 /100 | #230 | Tragic 6.4% |
| Panamanians | 3.1 /100 | #231 | Tragic 6.4% |
| Assyrians/Chaldeans/Syriacs | 2.4 /100 | #232 | Tragic 6.4% |
| Sub-Saharan Africans | 2.3 /100 | #233 | Tragic 6.4% |
| Immigrants | Liberia | 2.3 /100 | #234 | Tragic 6.4% |
| Hispanics or Latinos | 2.2 /100 | #235 | Tragic 6.4% |
| Dutch | 2.0 /100 | #236 | Tragic 6.4% |
| Immigrants | Germany | 1.8 /100 | #237 | Tragic 6.4% |
| Haitians | 1.8 /100 | #238 | Tragic 6.4% |
| Senegalese | 1.7 /100 | #239 | Tragic 6.4% |
| Immigrants | Senegal | 1.7 /100 | #240 | Tragic 6.4% |
| Immigrants | Haiti | 1.6 /100 | #241 | Tragic 6.5% |