Ghanaian vs Scotch-Irish Cognitive Disability
COMPARE
Ghanaian
Scotch-Irish
Cognitive Disability
Cognitive Disability Comparison
Ghanaians
Scotch-Irish
18.3%
COGNITIVE DISABILITY
0.0/ 100
METRIC RATING
299th/ 347
METRIC RANK
17.1%
COGNITIVE DISABILITY
85.9/ 100
METRIC RATING
147th/ 347
METRIC RANK
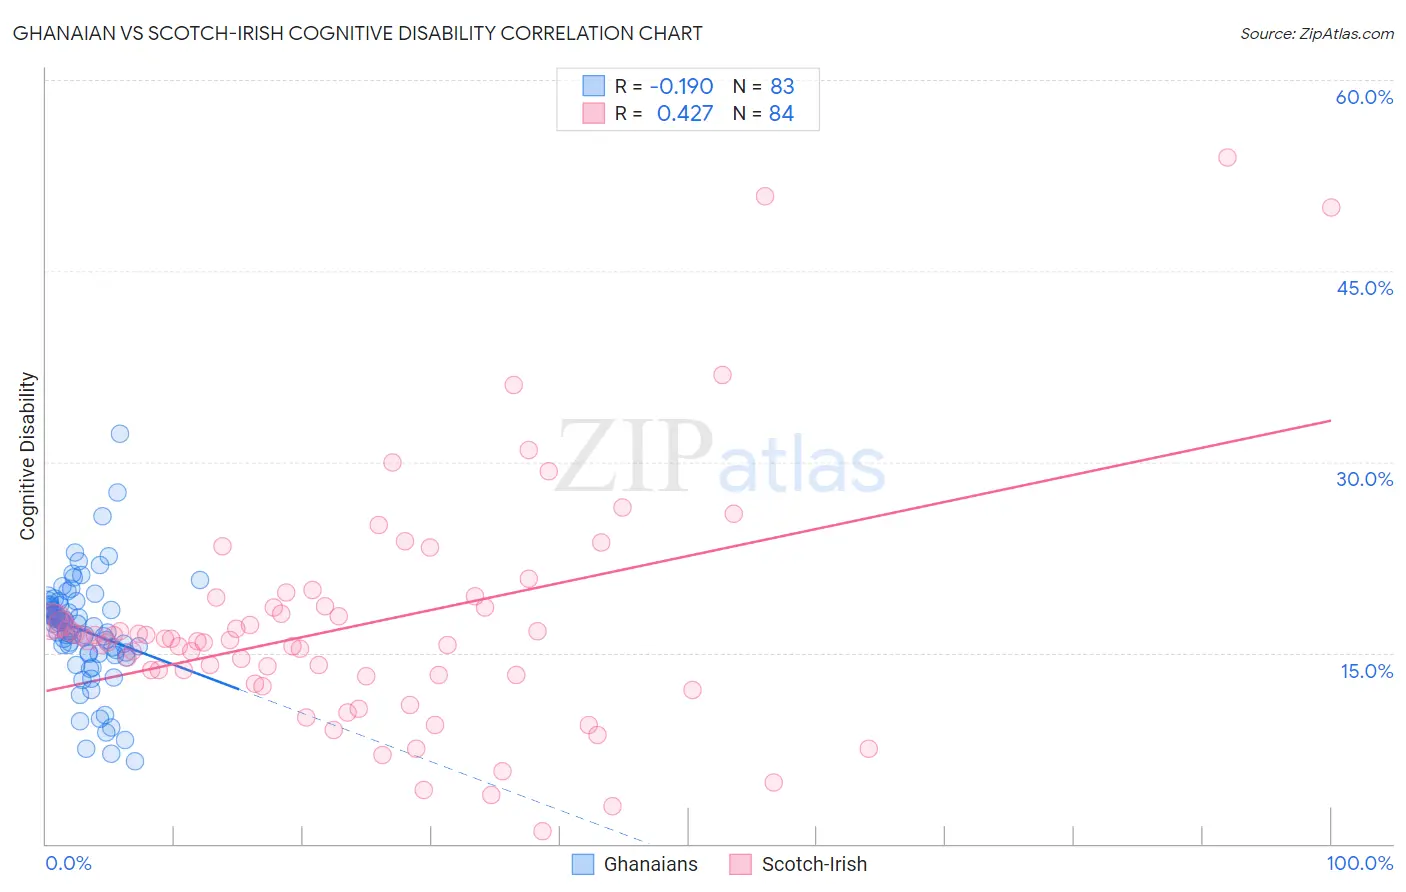
Ghanaian vs Scotch-Irish Cognitive Disability Correlation Chart
The statistical analysis conducted on geographies consisting of 190,691,747 people shows a poor negative correlation between the proportion of Ghanaians and percentage of population with cognitive disability in the United States with a correlation coefficient (R) of -0.190 and weighted average of 18.3%. Similarly, the statistical analysis conducted on geographies consisting of 548,652,939 people shows a moderate positive correlation between the proportion of Scotch-Irish and percentage of population with cognitive disability in the United States with a correlation coefficient (R) of 0.427 and weighted average of 17.1%, a difference of 7.1%.
Cognitive Disability Correlation Summary
| Measurement | Ghanaian | Scotch-Irish |
| Minimum | 6.5% | 0.99% |
| Maximum | 32.2% | 53.9% |
| Range | 25.7% | 52.9% |
| Mean | 16.7% | 17.2% |
| Median | 17.1% | 16.0% |
| Interquartile 25% (IQ1) | 15.0% | 13.2% |
| Interquartile 75% (IQ3) | 18.8% | 18.6% |
| Interquartile Range (IQR) | 3.8% | 5.4% |
| Standard Deviation (Sample) | 4.3% | 9.4% |
| Standard Deviation (Population) | 4.3% | 9.3% |
Similar Demographics by Cognitive Disability
Demographics Similar to Ghanaians by Cognitive Disability
In terms of cognitive disability, the demographic groups most similar to Ghanaians are Creek (18.3%, a difference of 0.020%), Japanese (18.3%, a difference of 0.030%), Blackfeet (18.3%, a difference of 0.040%), Immigrants from Ghana (18.3%, a difference of 0.17%), and Immigrants from Burma/Myanmar (18.2%, a difference of 0.18%).
| Demographics | Rating | Rank | Cognitive Disability |
| Iroquois | 0.1 /100 | #292 | Tragic 18.2% |
| Central American Indians | 0.1 /100 | #293 | Tragic 18.2% |
| British West Indians | 0.1 /100 | #294 | Tragic 18.2% |
| German Russians | 0.0 /100 | #295 | Tragic 18.2% |
| Immigrants | Burma/Myanmar | 0.0 /100 | #296 | Tragic 18.2% |
| Blackfeet | 0.0 /100 | #297 | Tragic 18.3% |
| Japanese | 0.0 /100 | #298 | Tragic 18.3% |
| Ghanaians | 0.0 /100 | #299 | Tragic 18.3% |
| Creek | 0.0 /100 | #300 | Tragic 18.3% |
| Immigrants | Ghana | 0.0 /100 | #301 | Tragic 18.3% |
| Barbadians | 0.0 /100 | #302 | Tragic 18.3% |
| Immigrants | Kenya | 0.0 /100 | #303 | Tragic 18.3% |
| Immigrants | Eritrea | 0.0 /100 | #304 | Tragic 18.3% |
| Colville | 0.0 /100 | #305 | Tragic 18.3% |
| Seminole | 0.0 /100 | #306 | Tragic 18.3% |
Demographics Similar to Scotch-Irish by Cognitive Disability
In terms of cognitive disability, the demographic groups most similar to Scotch-Irish are French Canadian (17.1%, a difference of 0.010%), Cypriot (17.1%, a difference of 0.010%), Basque (17.1%, a difference of 0.030%), Costa Rican (17.0%, a difference of 0.13%), and Syrian (17.1%, a difference of 0.16%).
| Demographics | Rating | Rank | Cognitive Disability |
| Chileans | 89.9 /100 | #140 | Excellent 17.0% |
| Aleuts | 89.9 /100 | #141 | Excellent 17.0% |
| Carpatho Rusyns | 89.6 /100 | #142 | Excellent 17.0% |
| British | 89.3 /100 | #143 | Excellent 17.0% |
| Immigrants | Brazil | 89.3 /100 | #144 | Excellent 17.0% |
| Immigrants | South Eastern Asia | 88.7 /100 | #145 | Excellent 17.0% |
| Costa Ricans | 88.0 /100 | #146 | Excellent 17.0% |
| Scotch-Irish | 85.9 /100 | #147 | Excellent 17.1% |
| French Canadians | 85.7 /100 | #148 | Excellent 17.1% |
| Cypriots | 85.7 /100 | #149 | Excellent 17.1% |
| Basques | 85.5 /100 | #150 | Excellent 17.1% |
| Syrians | 83.0 /100 | #151 | Excellent 17.1% |
| Immigrants | Indonesia | 82.7 /100 | #152 | Excellent 17.1% |
| Immigrants | Kazakhstan | 80.5 /100 | #153 | Excellent 17.1% |
| Immigrants | Malaysia | 79.3 /100 | #154 | Good 17.1% |