Ghanaian vs Immigrants from Uganda Cognitive Disability
COMPARE
Ghanaian
Immigrants from Uganda
Cognitive Disability
Cognitive Disability Comparison
Ghanaians
Immigrants from Uganda
18.3%
COGNITIVE DISABILITY
0.0/ 100
METRIC RATING
299th/ 347
METRIC RANK
18.1%
COGNITIVE DISABILITY
0.1/ 100
METRIC RATING
284th/ 347
METRIC RANK
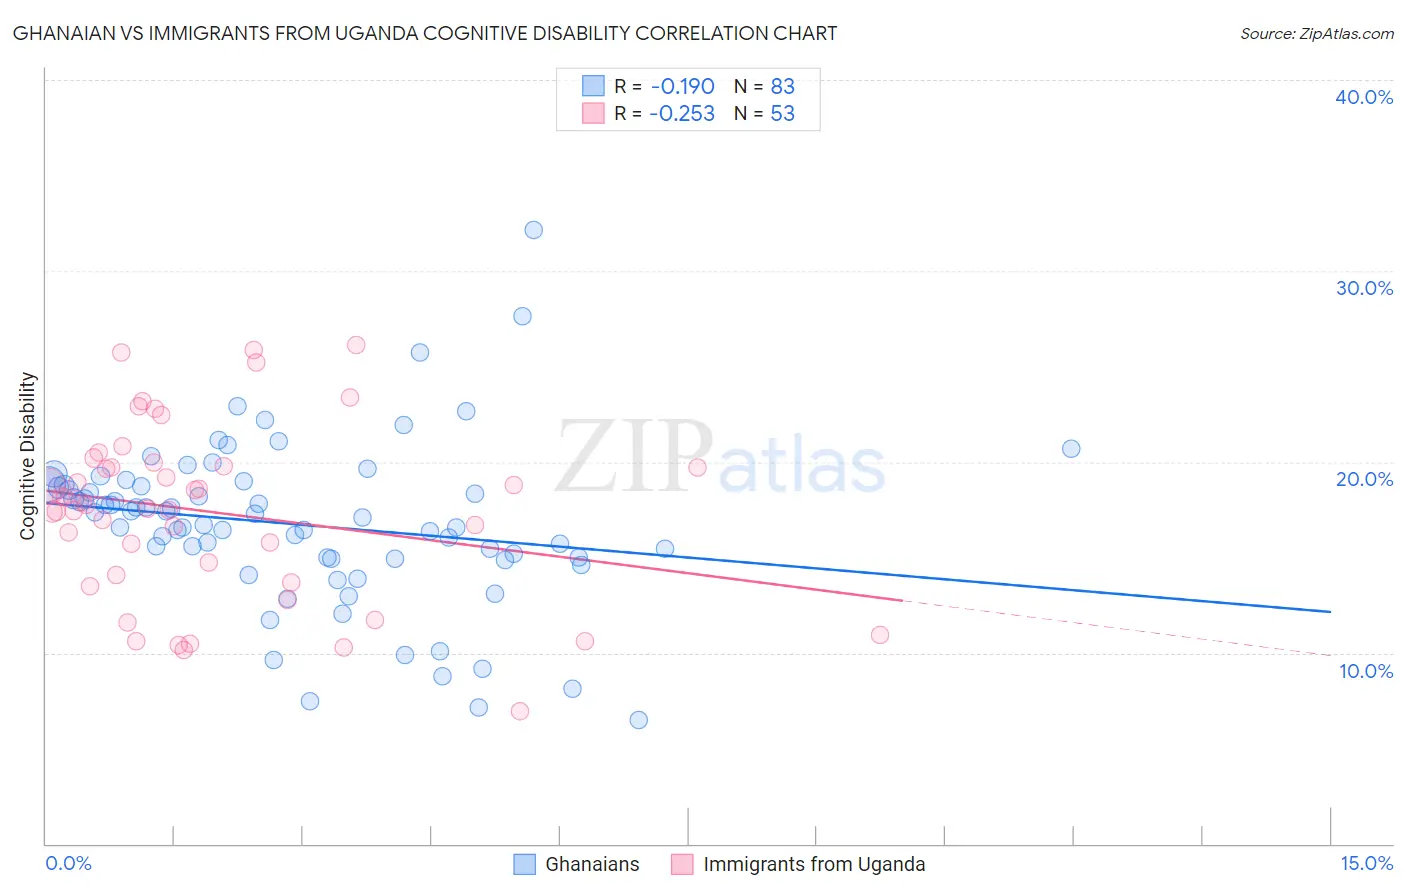
Ghanaian vs Immigrants from Uganda Cognitive Disability Correlation Chart
The statistical analysis conducted on geographies consisting of 190,691,747 people shows a poor negative correlation between the proportion of Ghanaians and percentage of population with cognitive disability in the United States with a correlation coefficient (R) of -0.190 and weighted average of 18.3%. Similarly, the statistical analysis conducted on geographies consisting of 125,981,524 people shows a weak negative correlation between the proportion of Immigrants from Uganda and percentage of population with cognitive disability in the United States with a correlation coefficient (R) of -0.253 and weighted average of 18.1%, a difference of 0.80%.
Cognitive Disability Correlation Summary
| Measurement | Ghanaian | Immigrants from Uganda |
| Minimum | 6.5% | 6.9% |
| Maximum | 32.2% | 26.1% |
| Range | 25.7% | 19.2% |
| Mean | 16.7% | 17.4% |
| Median | 17.1% | 17.7% |
| Interquartile 25% (IQ1) | 15.0% | 13.9% |
| Interquartile 75% (IQ3) | 18.8% | 19.9% |
| Interquartile Range (IQR) | 3.8% | 6.0% |
| Standard Deviation (Sample) | 4.3% | 4.6% |
| Standard Deviation (Population) | 4.3% | 4.5% |
Demographics Similar to Ghanaians and Immigrants from Uganda by Cognitive Disability
In terms of cognitive disability, the demographic groups most similar to Ghanaians are Creek (18.3%, a difference of 0.020%), Japanese (18.3%, a difference of 0.030%), Blackfeet (18.3%, a difference of 0.040%), Immigrants from Ghana (18.3%, a difference of 0.17%), and Immigrants from Burma/Myanmar (18.2%, a difference of 0.18%). Similarly, the demographic groups most similar to Immigrants from Uganda are Bermudan (18.1%, a difference of 0.010%), Nigerian (18.1%, a difference of 0.040%), Kenyan (18.1%, a difference of 0.050%), Immigrants from Cambodia (18.1%, a difference of 0.060%), and Yakama (18.1%, a difference of 0.090%).
| Demographics | Rating | Rank | Cognitive Disability |
| Yakama | 0.1 /100 | #281 | Tragic 18.1% |
| Immigrants | Cambodia | 0.1 /100 | #282 | Tragic 18.1% |
| Nigerians | 0.1 /100 | #283 | Tragic 18.1% |
| Immigrants | Uganda | 0.1 /100 | #284 | Tragic 18.1% |
| Bermudans | 0.1 /100 | #285 | Tragic 18.1% |
| Kenyans | 0.1 /100 | #286 | Tragic 18.1% |
| Dutch West Indians | 0.1 /100 | #287 | Tragic 18.1% |
| Immigrants | West Indies | 0.1 /100 | #288 | Tragic 18.1% |
| Natives/Alaskans | 0.1 /100 | #289 | Tragic 18.1% |
| Immigrants | Africa | 0.1 /100 | #290 | Tragic 18.1% |
| Ottawa | 0.1 /100 | #291 | Tragic 18.2% |
| Iroquois | 0.1 /100 | #292 | Tragic 18.2% |
| Central American Indians | 0.1 /100 | #293 | Tragic 18.2% |
| British West Indians | 0.1 /100 | #294 | Tragic 18.2% |
| German Russians | 0.0 /100 | #295 | Tragic 18.2% |
| Immigrants | Burma/Myanmar | 0.0 /100 | #296 | Tragic 18.2% |
| Blackfeet | 0.0 /100 | #297 | Tragic 18.3% |
| Japanese | 0.0 /100 | #298 | Tragic 18.3% |
| Ghanaians | 0.0 /100 | #299 | Tragic 18.3% |
| Creek | 0.0 /100 | #300 | Tragic 18.3% |
| Immigrants | Ghana | 0.0 /100 | #301 | Tragic 18.3% |