Ghanaian vs Pakistani Cognitive Disability
COMPARE
Ghanaian
Pakistani
Cognitive Disability
Cognitive Disability Comparison
Ghanaians
Pakistanis
18.3%
COGNITIVE DISABILITY
0.0/ 100
METRIC RATING
299th/ 347
METRIC RANK
17.3%
COGNITIVE DISABILITY
43.9/ 100
METRIC RATING
180th/ 347
METRIC RANK
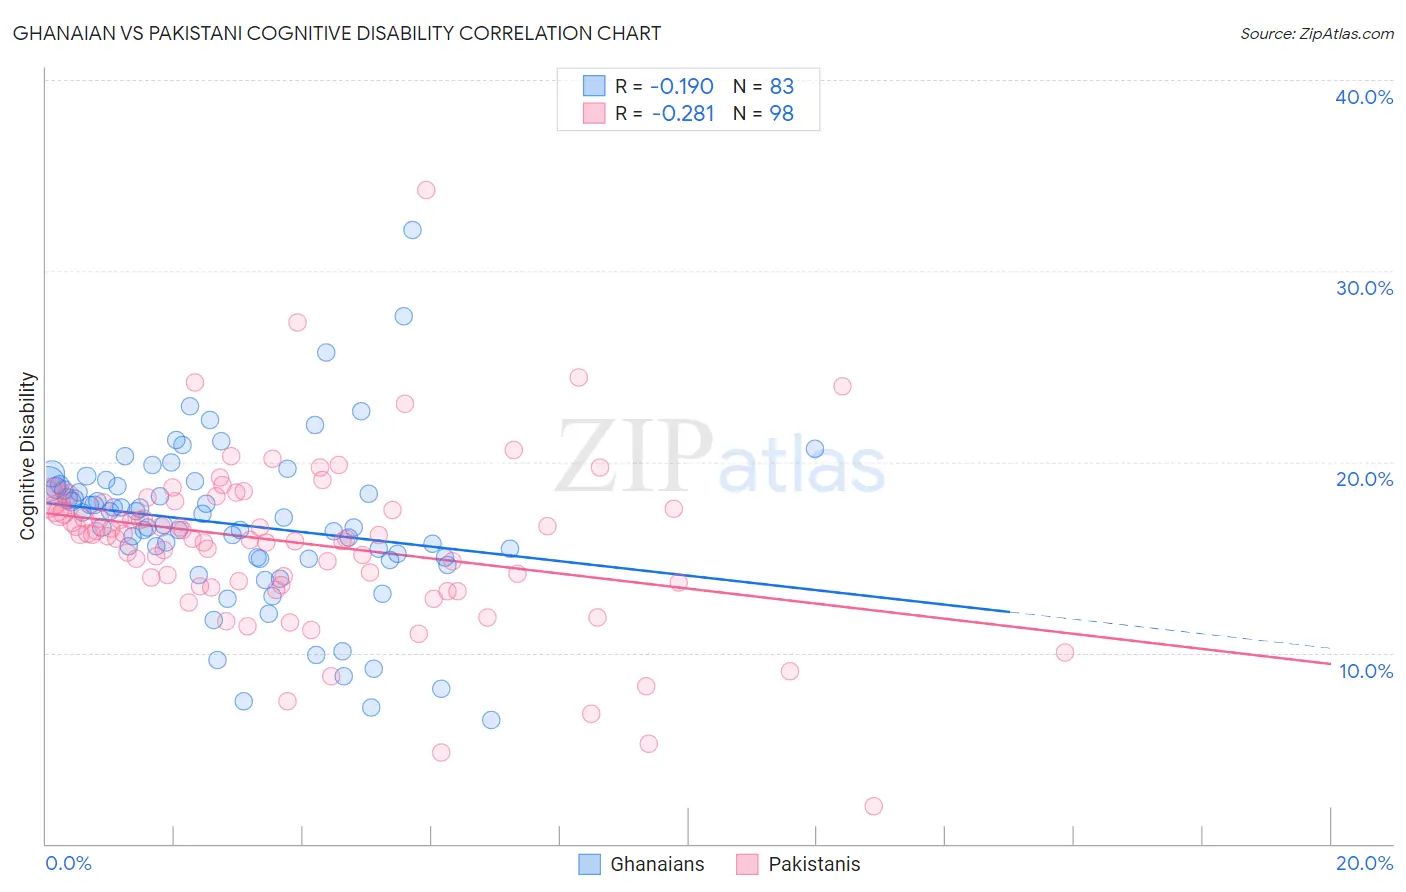
Ghanaian vs Pakistani Cognitive Disability Correlation Chart
The statistical analysis conducted on geographies consisting of 190,691,747 people shows a poor negative correlation between the proportion of Ghanaians and percentage of population with cognitive disability in the United States with a correlation coefficient (R) of -0.190 and weighted average of 18.3%. Similarly, the statistical analysis conducted on geographies consisting of 335,302,267 people shows a weak negative correlation between the proportion of Pakistanis and percentage of population with cognitive disability in the United States with a correlation coefficient (R) of -0.281 and weighted average of 17.3%, a difference of 5.5%.
Cognitive Disability Correlation Summary
| Measurement | Ghanaian | Pakistani |
| Minimum | 6.5% | 2.0% |
| Maximum | 32.2% | 34.2% |
| Range | 25.7% | 32.2% |
| Mean | 16.7% | 15.8% |
| Median | 17.1% | 16.2% |
| Interquartile 25% (IQ1) | 15.0% | 13.7% |
| Interquartile 75% (IQ3) | 18.8% | 17.9% |
| Interquartile Range (IQR) | 3.8% | 4.2% |
| Standard Deviation (Sample) | 4.3% | 4.5% |
| Standard Deviation (Population) | 4.3% | 4.4% |
Similar Demographics by Cognitive Disability
Demographics Similar to Ghanaians by Cognitive Disability
In terms of cognitive disability, the demographic groups most similar to Ghanaians are Creek (18.3%, a difference of 0.020%), Japanese (18.3%, a difference of 0.030%), Blackfeet (18.3%, a difference of 0.040%), Immigrants from Ghana (18.3%, a difference of 0.17%), and Immigrants from Burma/Myanmar (18.2%, a difference of 0.18%).
| Demographics | Rating | Rank | Cognitive Disability |
| Iroquois | 0.1 /100 | #292 | Tragic 18.2% |
| Central American Indians | 0.1 /100 | #293 | Tragic 18.2% |
| British West Indians | 0.1 /100 | #294 | Tragic 18.2% |
| German Russians | 0.0 /100 | #295 | Tragic 18.2% |
| Immigrants | Burma/Myanmar | 0.0 /100 | #296 | Tragic 18.2% |
| Blackfeet | 0.0 /100 | #297 | Tragic 18.3% |
| Japanese | 0.0 /100 | #298 | Tragic 18.3% |
| Ghanaians | 0.0 /100 | #299 | Tragic 18.3% |
| Creek | 0.0 /100 | #300 | Tragic 18.3% |
| Immigrants | Ghana | 0.0 /100 | #301 | Tragic 18.3% |
| Barbadians | 0.0 /100 | #302 | Tragic 18.3% |
| Immigrants | Kenya | 0.0 /100 | #303 | Tragic 18.3% |
| Immigrants | Eritrea | 0.0 /100 | #304 | Tragic 18.3% |
| Colville | 0.0 /100 | #305 | Tragic 18.3% |
| Seminole | 0.0 /100 | #306 | Tragic 18.3% |
Demographics Similar to Pakistanis by Cognitive Disability
In terms of cognitive disability, the demographic groups most similar to Pakistanis are Immigrants from Guyana (17.3%, a difference of 0.030%), Arab (17.3%, a difference of 0.030%), Spaniard (17.3%, a difference of 0.10%), Sioux (17.3%, a difference of 0.13%), and Spanish (17.3%, a difference of 0.14%).
| Demographics | Rating | Rank | Cognitive Disability |
| Immigrants | Northern Africa | 50.2 /100 | #173 | Average 17.3% |
| Laotians | 50.0 /100 | #174 | Average 17.3% |
| Tsimshian | 49.8 /100 | #175 | Average 17.3% |
| Shoshone | 49.2 /100 | #176 | Average 17.3% |
| Ute | 49.1 /100 | #177 | Average 17.3% |
| Spanish | 48.9 /100 | #178 | Average 17.3% |
| Sioux | 48.6 /100 | #179 | Average 17.3% |
| Pakistanis | 43.9 /100 | #180 | Average 17.3% |
| Immigrants | Guyana | 42.9 /100 | #181 | Average 17.3% |
| Arabs | 42.8 /100 | #182 | Average 17.3% |
| Spaniards | 40.3 /100 | #183 | Average 17.3% |
| Crow | 39.1 /100 | #184 | Fair 17.3% |
| Afghans | 38.2 /100 | #185 | Fair 17.3% |
| Cambodians | 35.9 /100 | #186 | Fair 17.3% |
| Immigrants | Fiji | 33.7 /100 | #187 | Fair 17.4% |