Ghanaian vs Nicaraguan Single Male Poverty
COMPARE
Ghanaian
Nicaraguan
Single Male Poverty
Single Male Poverty Comparison
Ghanaians
Nicaraguans
13.3%
SINGLE MALE POVERTY
6.1/ 100
METRIC RATING
230th/ 347
METRIC RANK
12.4%
SINGLE MALE POVERTY
92.1/ 100
METRIC RATING
114th/ 347
METRIC RANK
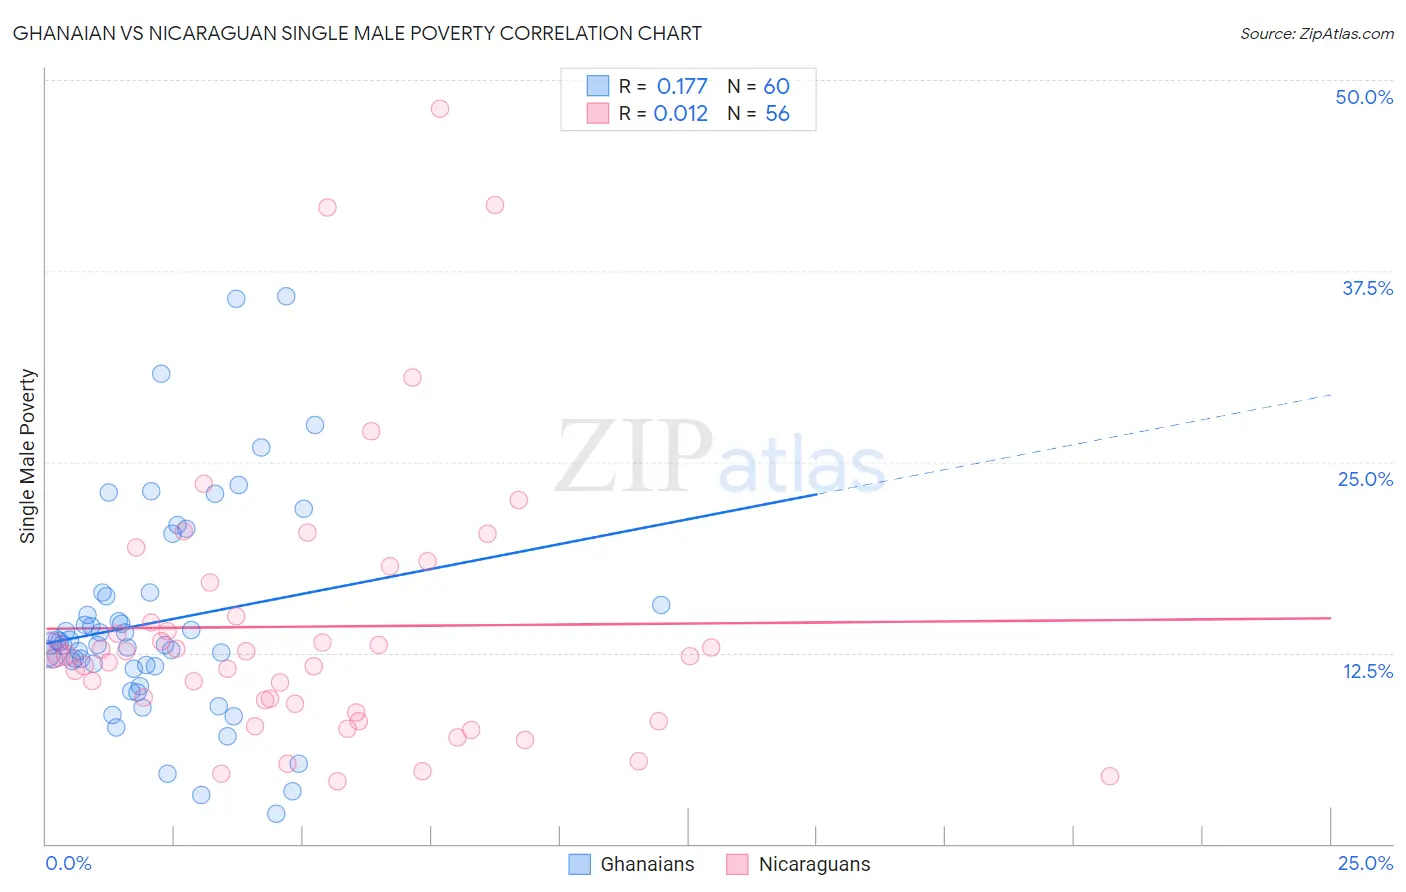
Ghanaian vs Nicaraguan Single Male Poverty Correlation Chart
The statistical analysis conducted on geographies consisting of 177,869,684 people shows a poor positive correlation between the proportion of Ghanaians and poverty level among single males in the United States with a correlation coefficient (R) of 0.177 and weighted average of 13.3%. Similarly, the statistical analysis conducted on geographies consisting of 265,372,513 people shows no correlation between the proportion of Nicaraguans and poverty level among single males in the United States with a correlation coefficient (R) of 0.012 and weighted average of 12.4%, a difference of 7.1%.
Single Male Poverty Correlation Summary
| Measurement | Ghanaian | Nicaraguan |
| Minimum | 2.0% | 4.1% |
| Maximum | 35.8% | 48.1% |
| Range | 33.9% | 44.0% |
| Mean | 14.5% | 14.2% |
| Median | 13.1% | 12.4% |
| Interquartile 25% (IQ1) | 11.5% | 8.9% |
| Interquartile 75% (IQ3) | 16.3% | 16.0% |
| Interquartile Range (IQR) | 4.8% | 7.1% |
| Standard Deviation (Sample) | 7.0% | 9.1% |
| Standard Deviation (Population) | 7.0% | 9.0% |
Similar Demographics by Single Male Poverty
Demographics Similar to Ghanaians by Single Male Poverty
In terms of single male poverty, the demographic groups most similar to Ghanaians are European (13.3%, a difference of 0.030%), Lebanese (13.2%, a difference of 0.12%), Slavic (13.3%, a difference of 0.18%), Haitian (13.2%, a difference of 0.20%), and Immigrants from Caribbean (13.3%, a difference of 0.27%).
| Demographics | Rating | Rank | Single Male Poverty |
| Immigrants | Azores | 9.3 /100 | #223 | Tragic 13.2% |
| Somalis | 9.1 /100 | #224 | Tragic 13.2% |
| Immigrants | Denmark | 8.7 /100 | #225 | Tragic 13.2% |
| Jamaicans | 7.7 /100 | #226 | Tragic 13.2% |
| Haitians | 7.0 /100 | #227 | Tragic 13.2% |
| Lebanese | 6.6 /100 | #228 | Tragic 13.2% |
| Europeans | 6.2 /100 | #229 | Tragic 13.3% |
| Ghanaians | 6.1 /100 | #230 | Tragic 13.3% |
| Slavs | 5.3 /100 | #231 | Tragic 13.3% |
| Immigrants | Caribbean | 5.0 /100 | #232 | Tragic 13.3% |
| British | 4.0 /100 | #233 | Tragic 13.3% |
| Canadians | 4.0 /100 | #234 | Tragic 13.3% |
| Bangladeshis | 3.7 /100 | #235 | Tragic 13.3% |
| Luxembourgers | 3.6 /100 | #236 | Tragic 13.4% |
| British West Indians | 3.4 /100 | #237 | Tragic 13.4% |
Demographics Similar to Nicaraguans by Single Male Poverty
In terms of single male poverty, the demographic groups most similar to Nicaraguans are Pakistani (12.4%, a difference of 0.050%), Immigrants from Southern Europe (12.4%, a difference of 0.11%), Immigrants from Syria (12.4%, a difference of 0.16%), Immigrants from Oceania (12.4%, a difference of 0.18%), and Kenyan (12.4%, a difference of 0.23%).
| Demographics | Rating | Rank | Single Male Poverty |
| Iraqis | 95.1 /100 | #107 | Exceptional 12.3% |
| Immigrants | Eastern Africa | 95.0 /100 | #108 | Exceptional 12.3% |
| Ugandans | 94.5 /100 | #109 | Exceptional 12.3% |
| Immigrants | Portugal | 93.6 /100 | #110 | Exceptional 12.3% |
| Immigrants | North Macedonia | 93.6 /100 | #111 | Exceptional 12.3% |
| Kenyans | 93.3 /100 | #112 | Exceptional 12.4% |
| Pakistanis | 92.4 /100 | #113 | Exceptional 12.4% |
| Nicaraguans | 92.1 /100 | #114 | Exceptional 12.4% |
| Immigrants | Southern Europe | 91.5 /100 | #115 | Exceptional 12.4% |
| Immigrants | Syria | 91.2 /100 | #116 | Exceptional 12.4% |
| Immigrants | Oceania | 91.1 /100 | #117 | Exceptional 12.4% |
| Albanians | 90.6 /100 | #118 | Exceptional 12.4% |
| Immigrants | Albania | 90.3 /100 | #119 | Exceptional 12.4% |
| Venezuelans | 89.4 /100 | #120 | Excellent 12.4% |
| Icelanders | 88.2 /100 | #121 | Excellent 12.5% |