Finnish vs Immigrants from Afghanistan Female Disability
COMPARE
Finnish
Immigrants from Afghanistan
Female Disability
Female Disability Comparison
Finns
Immigrants from Afghanistan
12.8%
FEMALE DISABILITY
0.4/ 100
METRIC RATING
266th/ 347
METRIC RANK
11.5%
FEMALE DISABILITY
99.7/ 100
METRIC RATING
77th/ 347
METRIC RANK
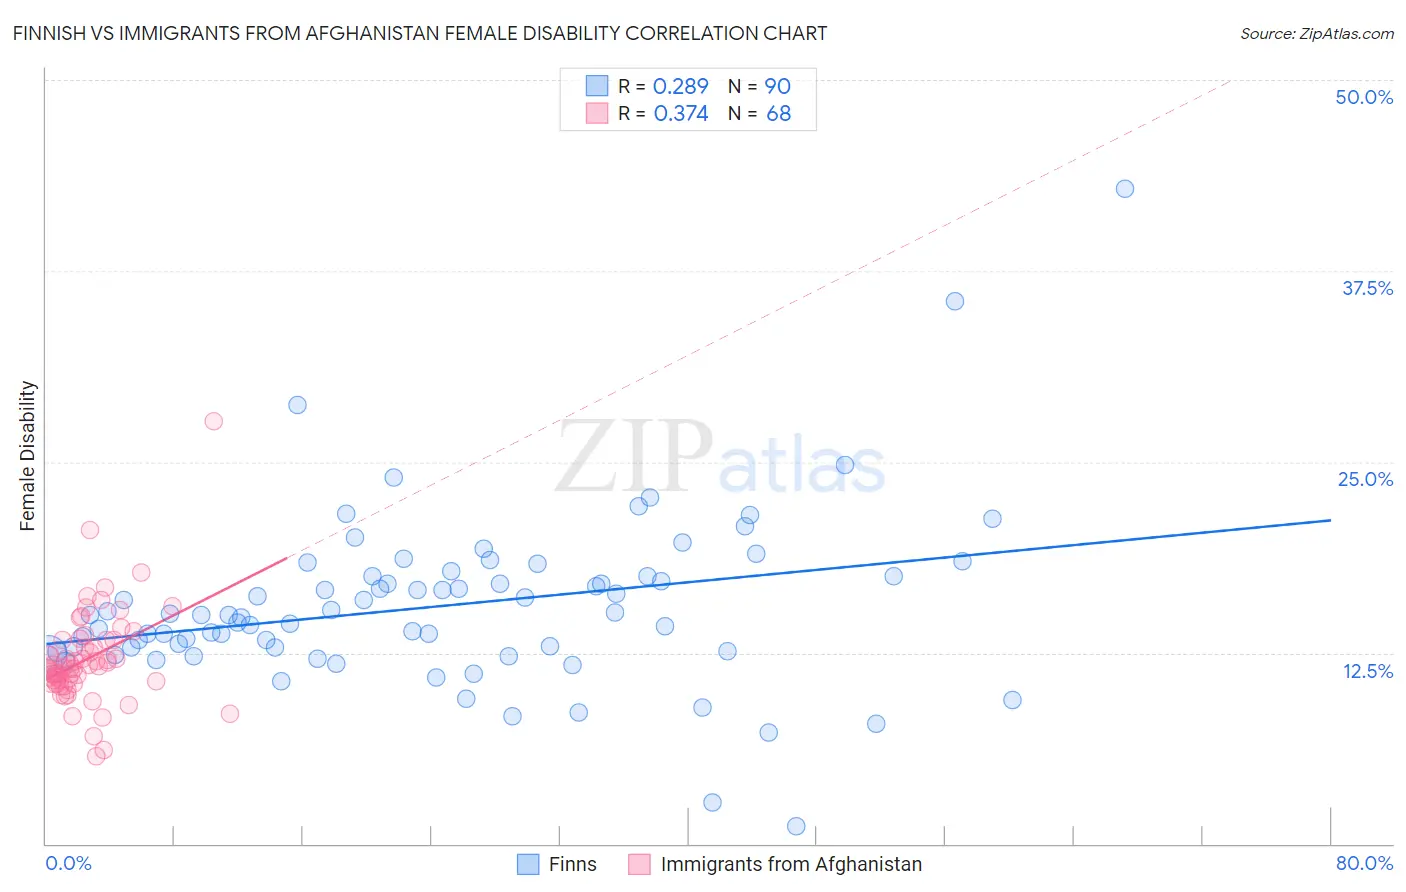
Finnish vs Immigrants from Afghanistan Female Disability Correlation Chart
The statistical analysis conducted on geographies consisting of 404,612,195 people shows a weak positive correlation between the proportion of Finns and percentage of females with a disability in the United States with a correlation coefficient (R) of 0.289 and weighted average of 12.8%. Similarly, the statistical analysis conducted on geographies consisting of 147,644,439 people shows a mild positive correlation between the proportion of Immigrants from Afghanistan and percentage of females with a disability in the United States with a correlation coefficient (R) of 0.374 and weighted average of 11.5%, a difference of 11.3%.
Female Disability Correlation Summary
| Measurement | Finnish | Immigrants from Afghanistan |
| Minimum | 1.2% | 5.7% |
| Maximum | 42.9% | 27.6% |
| Range | 41.7% | 21.9% |
| Mean | 15.5% | 12.1% |
| Median | 15.0% | 11.6% |
| Interquartile 25% (IQ1) | 12.6% | 10.6% |
| Interquartile 75% (IQ3) | 17.5% | 13.3% |
| Interquartile Range (IQR) | 5.0% | 2.7% |
| Standard Deviation (Sample) | 5.6% | 3.2% |
| Standard Deviation (Population) | 5.6% | 3.2% |
Similar Demographics by Female Disability
Demographics Similar to Finns by Female Disability
In terms of female disability, the demographic groups most similar to Finns are Senegalese (12.8%, a difference of 0.020%), Immigrants from Laos (12.8%, a difference of 0.040%), Indonesian (12.8%, a difference of 0.10%), West Indian (12.8%, a difference of 0.12%), and Immigrants from Liberia (12.9%, a difference of 0.28%).
| Demographics | Rating | Rank | Female Disability |
| Immigrants | Armenia | 1.0 /100 | #259 | Tragic 12.7% |
| Sub-Saharan Africans | 1.0 /100 | #260 | Tragic 12.7% |
| Bermudans | 1.0 /100 | #261 | Tragic 12.7% |
| Czechoslovakians | 0.9 /100 | #262 | Tragic 12.7% |
| Spaniards | 0.7 /100 | #263 | Tragic 12.8% |
| Alaska Natives | 0.6 /100 | #264 | Tragic 12.8% |
| West Indians | 0.5 /100 | #265 | Tragic 12.8% |
| Finns | 0.4 /100 | #266 | Tragic 12.8% |
| Senegalese | 0.4 /100 | #267 | Tragic 12.8% |
| Immigrants | Laos | 0.4 /100 | #268 | Tragic 12.8% |
| Indonesians | 0.4 /100 | #269 | Tragic 12.8% |
| Immigrants | Liberia | 0.3 /100 | #270 | Tragic 12.9% |
| Dutch | 0.2 /100 | #271 | Tragic 12.9% |
| Germans | 0.1 /100 | #272 | Tragic 12.9% |
| Sioux | 0.1 /100 | #273 | Tragic 12.9% |
Demographics Similar to Immigrants from Afghanistan by Female Disability
In terms of female disability, the demographic groups most similar to Immigrants from Afghanistan are Immigrants from Eritrea (11.5%, a difference of 0.0%), Immigrants from South Africa (11.5%, a difference of 0.010%), Immigrants from Lebanon (11.5%, a difference of 0.030%), Sierra Leonean (11.5%, a difference of 0.030%), and Immigrants from Jordan (11.5%, a difference of 0.040%).
| Demographics | Rating | Rank | Female Disability |
| Immigrants | Chile | 99.8 /100 | #70 | Exceptional 11.5% |
| Immigrants | Ireland | 99.8 /100 | #71 | Exceptional 11.5% |
| Chileans | 99.8 /100 | #72 | Exceptional 11.5% |
| Immigrants | Switzerland | 99.8 /100 | #73 | Exceptional 11.5% |
| Bhutanese | 99.8 /100 | #74 | Exceptional 11.5% |
| Immigrants | Lebanon | 99.7 /100 | #75 | Exceptional 11.5% |
| Immigrants | Eritrea | 99.7 /100 | #76 | Exceptional 11.5% |
| Immigrants | Afghanistan | 99.7 /100 | #77 | Exceptional 11.5% |
| Immigrants | South Africa | 99.7 /100 | #78 | Exceptional 11.5% |
| Sierra Leoneans | 99.7 /100 | #79 | Exceptional 11.5% |
| Immigrants | Jordan | 99.7 /100 | #80 | Exceptional 11.5% |
| Eastern Europeans | 99.7 /100 | #81 | Exceptional 11.5% |
| Luxembourgers | 99.6 /100 | #82 | Exceptional 11.6% |
| Immigrants | Serbia | 99.6 /100 | #83 | Exceptional 11.6% |
| Immigrants | Poland | 99.6 /100 | #84 | Exceptional 11.6% |