Immigrants from Serbia vs Creek Male Disability
COMPARE
Immigrants from Serbia
Creek
Male Disability
Male Disability Comparison
Immigrants from Serbia
Creek
10.5%
MALE DISABILITY
99.0/ 100
METRIC RATING
72nd/ 347
METRIC RANK
15.5%
MALE DISABILITY
0.0/ 100
METRIC RATING
343rd/ 347
METRIC RANK
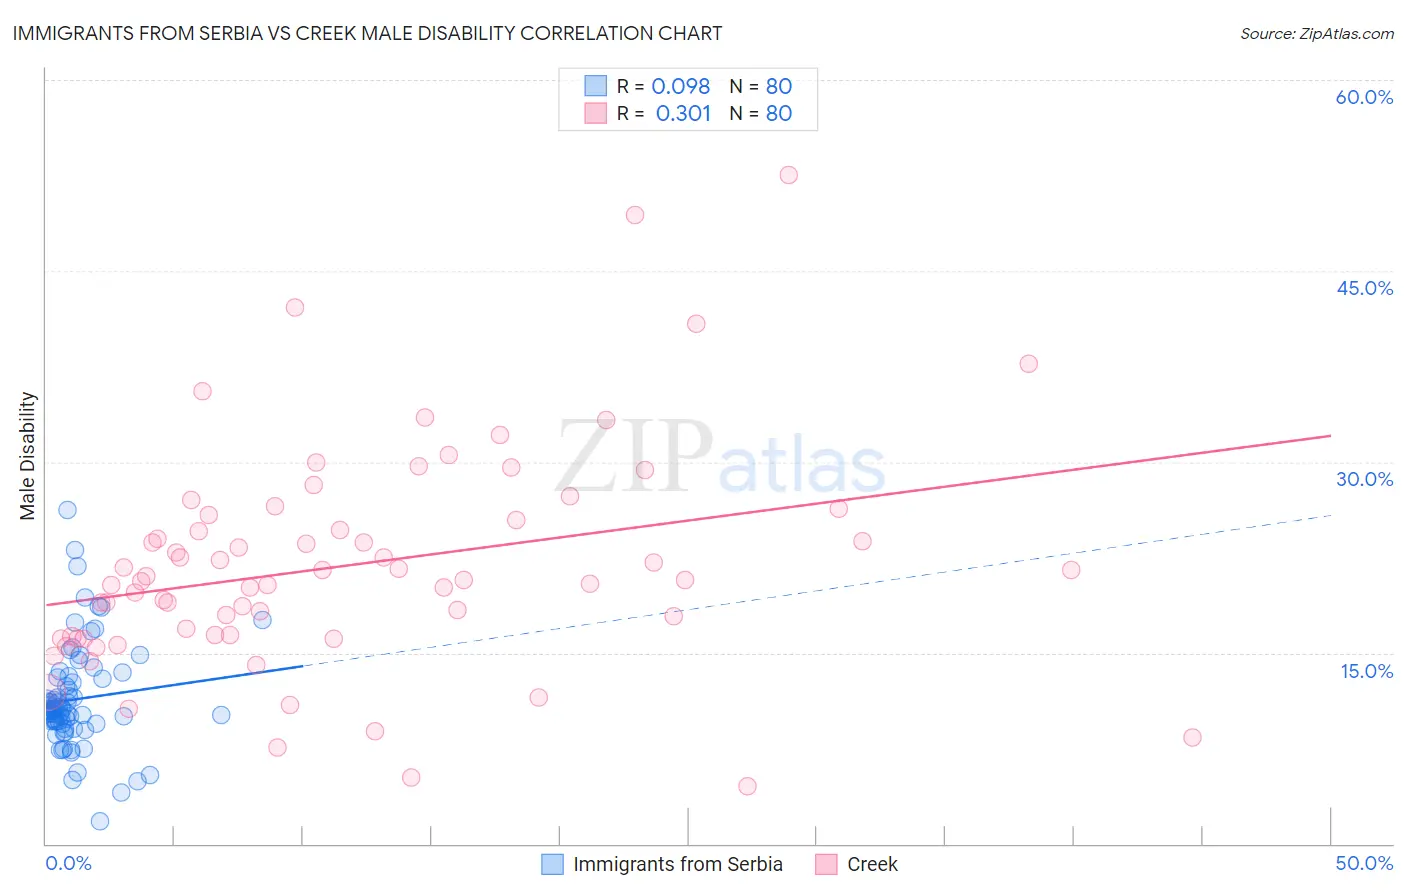
Immigrants from Serbia vs Creek Male Disability Correlation Chart
The statistical analysis conducted on geographies consisting of 131,743,727 people shows a slight positive correlation between the proportion of Immigrants from Serbia and percentage of males with a disability in the United States with a correlation coefficient (R) of 0.098 and weighted average of 10.5%. Similarly, the statistical analysis conducted on geographies consisting of 178,460,797 people shows a mild positive correlation between the proportion of Creek and percentage of males with a disability in the United States with a correlation coefficient (R) of 0.301 and weighted average of 15.5%, a difference of 47.8%.
Male Disability Correlation Summary
| Measurement | Immigrants from Serbia | Creek |
| Minimum | 1.8% | 4.5% |
| Maximum | 26.3% | 52.5% |
| Range | 24.5% | 48.1% |
| Mean | 11.4% | 21.9% |
| Median | 10.5% | 20.7% |
| Interquartile 25% (IQ1) | 9.5% | 16.3% |
| Interquartile 75% (IQ3) | 13.0% | 25.6% |
| Interquartile Range (IQR) | 3.5% | 9.3% |
| Standard Deviation (Sample) | 4.1% | 8.7% |
| Standard Deviation (Population) | 4.1% | 8.7% |
Similar Demographics by Male Disability
Demographics Similar to Immigrants from Serbia by Male Disability
In terms of male disability, the demographic groups most similar to Immigrants from Serbia are Immigrants from Cameroon (10.5%, a difference of 0.060%), Immigrants from Lithuania (10.5%, a difference of 0.060%), Immigrants from Bulgaria (10.5%, a difference of 0.20%), Immigrants from Lebanon (10.5%, a difference of 0.21%), and Sierra Leonean (10.5%, a difference of 0.33%).
| Demographics | Rating | Rank | Male Disability |
| Immigrants | Grenada | 99.2 /100 | #65 | Exceptional 10.5% |
| Guyanese | 99.2 /100 | #66 | Exceptional 10.5% |
| Immigrants | Afghanistan | 99.2 /100 | #67 | Exceptional 10.5% |
| Colombians | 99.2 /100 | #68 | Exceptional 10.5% |
| Ecuadorians | 99.2 /100 | #69 | Exceptional 10.5% |
| Immigrants | Bulgaria | 99.1 /100 | #70 | Exceptional 10.5% |
| Immigrants | Cameroon | 99.0 /100 | #71 | Exceptional 10.5% |
| Immigrants | Serbia | 99.0 /100 | #72 | Exceptional 10.5% |
| Immigrants | Lithuania | 98.9 /100 | #73 | Exceptional 10.5% |
| Immigrants | Lebanon | 98.8 /100 | #74 | Exceptional 10.5% |
| Sierra Leoneans | 98.7 /100 | #75 | Exceptional 10.5% |
| Immigrants | Sierra Leone | 98.7 /100 | #76 | Exceptional 10.5% |
| Laotians | 98.6 /100 | #77 | Exceptional 10.6% |
| Immigrants | Russia | 98.6 /100 | #78 | Exceptional 10.6% |
| Zimbabweans | 98.4 /100 | #79 | Exceptional 10.6% |
Demographics Similar to Creek by Male Disability
In terms of male disability, the demographic groups most similar to Creek are Puerto Rican (15.6%, a difference of 0.13%), Tsimshian (15.6%, a difference of 0.45%), Kiowa (15.4%, a difference of 0.66%), Choctaw (15.4%, a difference of 0.85%), and Lumbee (15.2%, a difference of 2.0%).
| Demographics | Rating | Rank | Male Disability |
| Yuman | 0.0 /100 | #333 | Tragic 14.7% |
| Cherokee | 0.0 /100 | #334 | Tragic 14.8% |
| Dutch West Indians | 0.0 /100 | #335 | Tragic 14.8% |
| Alaskan Athabascans | 0.0 /100 | #336 | Tragic 14.9% |
| Menominee | 0.0 /100 | #337 | Tragic 15.0% |
| Pueblo | 0.0 /100 | #338 | Tragic 15.0% |
| Chickasaw | 0.0 /100 | #339 | Tragic 15.1% |
| Lumbee | 0.0 /100 | #340 | Tragic 15.2% |
| Choctaw | 0.0 /100 | #341 | Tragic 15.4% |
| Kiowa | 0.0 /100 | #342 | Tragic 15.4% |
| Creek | 0.0 /100 | #343 | Tragic 15.5% |
| Puerto Ricans | 0.0 /100 | #344 | Tragic 15.6% |
| Tsimshian | 0.0 /100 | #345 | Tragic 15.6% |
| Colville | 0.0 /100 | #346 | Tragic 16.5% |
| Houma | 0.0 /100 | #347 | Tragic 17.4% |