Russian vs Creek Male Disability
COMPARE
Russian
Creek
Male Disability
Male Disability Comparison
Russians
Creek
11.1%
MALE DISABILITY
69.8/ 100
METRIC RATING
156th/ 347
METRIC RANK
15.5%
MALE DISABILITY
0.0/ 100
METRIC RATING
343rd/ 347
METRIC RANK
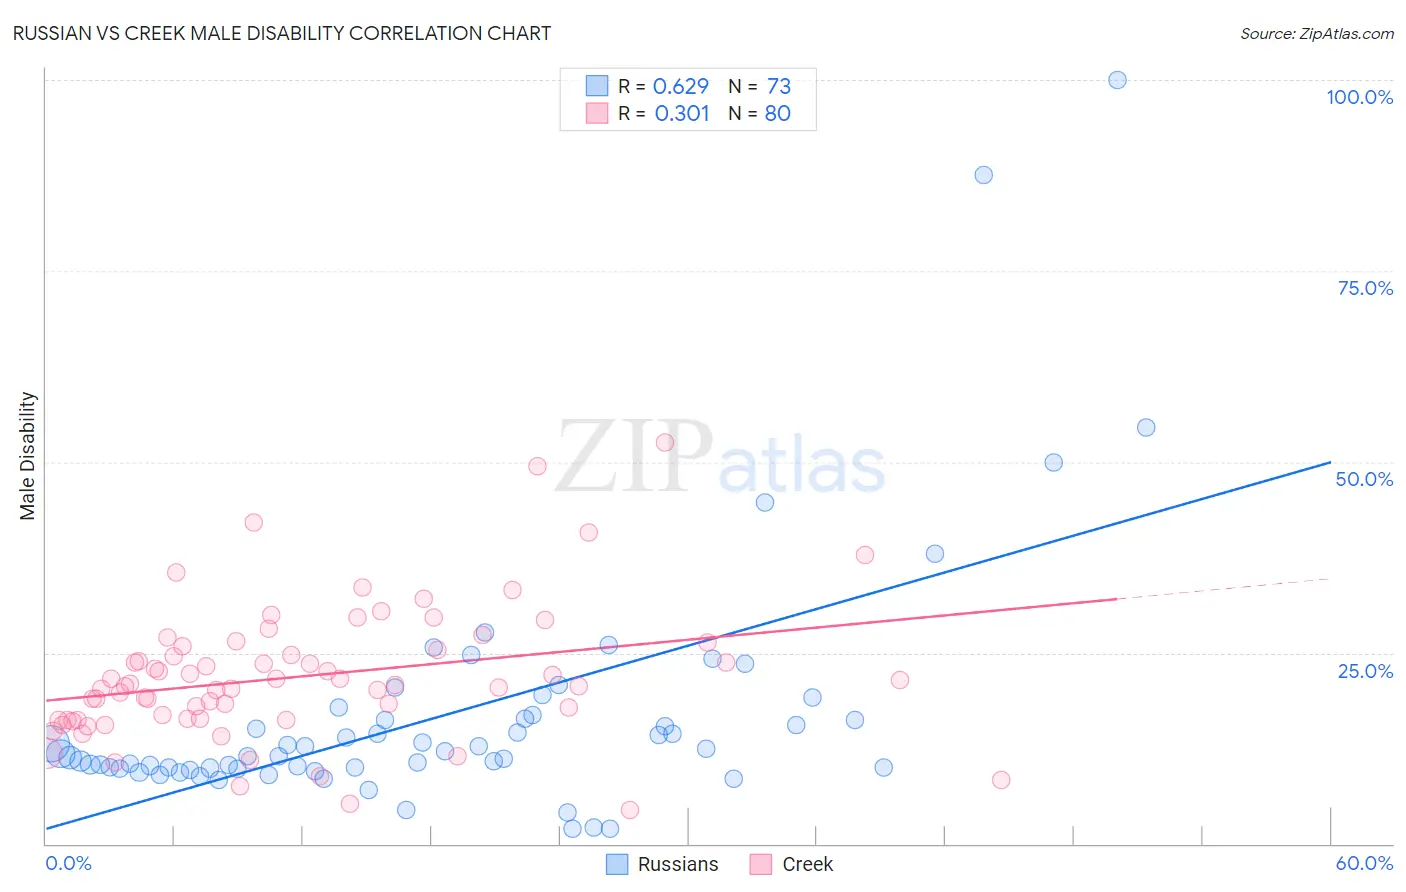
Russian vs Creek Male Disability Correlation Chart
The statistical analysis conducted on geographies consisting of 512,092,434 people shows a significant positive correlation between the proportion of Russians and percentage of males with a disability in the United States with a correlation coefficient (R) of 0.629 and weighted average of 11.1%. Similarly, the statistical analysis conducted on geographies consisting of 178,460,797 people shows a mild positive correlation between the proportion of Creek and percentage of males with a disability in the United States with a correlation coefficient (R) of 0.301 and weighted average of 15.5%, a difference of 40.1%.
Male Disability Correlation Summary
| Measurement | Russian | Creek |
| Minimum | 2.0% | 4.5% |
| Maximum | 100.0% | 52.5% |
| Range | 98.0% | 48.1% |
| Mean | 16.8% | 21.9% |
| Median | 11.8% | 20.7% |
| Interquartile 25% (IQ1) | 9.9% | 16.3% |
| Interquartile 75% (IQ3) | 16.7% | 25.6% |
| Interquartile Range (IQR) | 6.8% | 9.3% |
| Standard Deviation (Sample) | 16.2% | 8.7% |
| Standard Deviation (Population) | 16.1% | 8.7% |
Similar Demographics by Male Disability
Demographics Similar to Russians by Male Disability
In terms of male disability, the demographic groups most similar to Russians are Immigrants from Western Africa (11.1%, a difference of 0.040%), Immigrants from Middle Africa (11.1%, a difference of 0.070%), Latvian (11.1%, a difference of 0.11%), Guatemalan (11.1%, a difference of 0.17%), and Immigrants from Moldova (11.1%, a difference of 0.21%).
| Demographics | Rating | Rank | Male Disability |
| Immigrants | Denmark | 76.4 /100 | #149 | Good 11.0% |
| Immigrants | Guatemala | 75.1 /100 | #150 | Good 11.0% |
| Cubans | 74.9 /100 | #151 | Good 11.0% |
| Immigrants | Albania | 74.4 /100 | #152 | Good 11.0% |
| Immigrants | Northern Europe | 73.2 /100 | #153 | Good 11.1% |
| Immigrants | Moldova | 72.8 /100 | #154 | Good 11.1% |
| Immigrants | Middle Africa | 70.9 /100 | #155 | Good 11.1% |
| Russians | 69.8 /100 | #156 | Good 11.1% |
| Immigrants | Western Africa | 69.2 /100 | #157 | Good 11.1% |
| Latvians | 68.1 /100 | #158 | Good 11.1% |
| Guatemalans | 67.2 /100 | #159 | Good 11.1% |
| Albanians | 66.5 /100 | #160 | Good 11.1% |
| Immigrants | West Indies | 65.7 /100 | #161 | Good 11.1% |
| Immigrants | Haiti | 65.3 /100 | #162 | Good 11.1% |
| Immigrants | Kenya | 63.8 /100 | #163 | Good 11.1% |
Demographics Similar to Creek by Male Disability
In terms of male disability, the demographic groups most similar to Creek are Puerto Rican (15.6%, a difference of 0.13%), Tsimshian (15.6%, a difference of 0.45%), Kiowa (15.4%, a difference of 0.66%), Choctaw (15.4%, a difference of 0.85%), and Lumbee (15.2%, a difference of 2.0%).
| Demographics | Rating | Rank | Male Disability |
| Yuman | 0.0 /100 | #333 | Tragic 14.7% |
| Cherokee | 0.0 /100 | #334 | Tragic 14.8% |
| Dutch West Indians | 0.0 /100 | #335 | Tragic 14.8% |
| Alaskan Athabascans | 0.0 /100 | #336 | Tragic 14.9% |
| Menominee | 0.0 /100 | #337 | Tragic 15.0% |
| Pueblo | 0.0 /100 | #338 | Tragic 15.0% |
| Chickasaw | 0.0 /100 | #339 | Tragic 15.1% |
| Lumbee | 0.0 /100 | #340 | Tragic 15.2% |
| Choctaw | 0.0 /100 | #341 | Tragic 15.4% |
| Kiowa | 0.0 /100 | #342 | Tragic 15.4% |
| Creek | 0.0 /100 | #343 | Tragic 15.5% |
| Puerto Ricans | 0.0 /100 | #344 | Tragic 15.6% |
| Tsimshian | 0.0 /100 | #345 | Tragic 15.6% |
| Colville | 0.0 /100 | #346 | Tragic 16.5% |
| Houma | 0.0 /100 | #347 | Tragic 17.4% |