Immigrants from Uruguay vs Albanian Hearing Disability
COMPARE
Immigrants from Uruguay
Albanian
Hearing Disability
Hearing Disability Comparison
Immigrants from Uruguay
Albanians
2.7%
HEARING DISABILITY
97.2/ 100
METRIC RATING
81st/ 347
METRIC RANK
2.9%
HEARING DISABILITY
66.6/ 100
METRIC RATING
161st/ 347
METRIC RANK
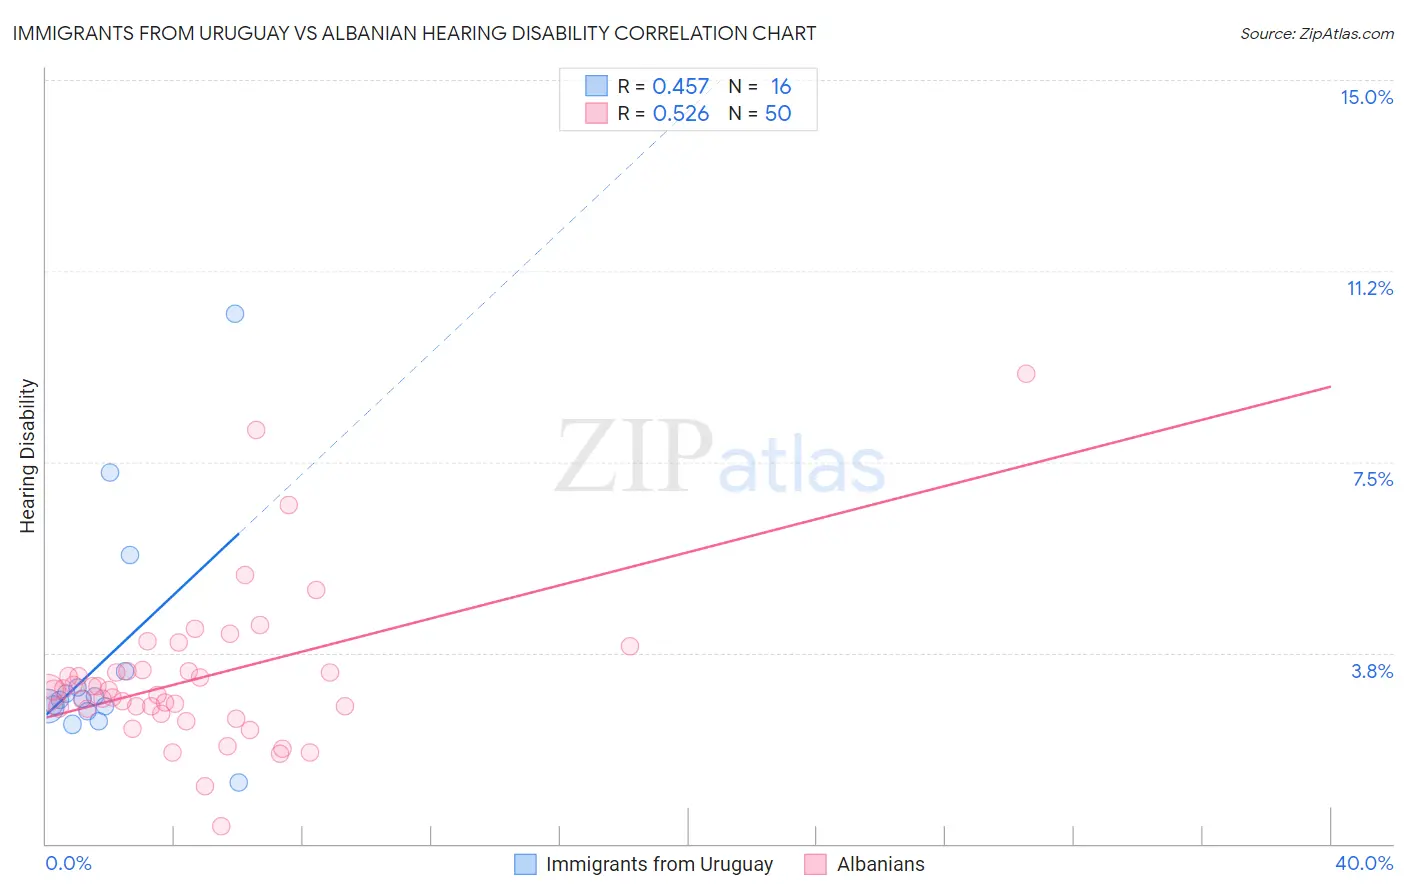
Immigrants from Uruguay vs Albanian Hearing Disability Correlation Chart
The statistical analysis conducted on geographies consisting of 133,251,950 people shows a moderate positive correlation between the proportion of Immigrants from Uruguay and percentage of population with hearing disability in the United States with a correlation coefficient (R) of 0.457 and weighted average of 2.7%. Similarly, the statistical analysis conducted on geographies consisting of 193,249,073 people shows a substantial positive correlation between the proportion of Albanians and percentage of population with hearing disability in the United States with a correlation coefficient (R) of 0.526 and weighted average of 2.9%, a difference of 7.3%.
Hearing Disability Correlation Summary
| Measurement | Immigrants from Uruguay | Albanian |
| Minimum | 1.2% | 0.33% |
| Maximum | 10.4% | 9.2% |
| Range | 9.2% | 8.9% |
| Mean | 3.6% | 3.3% |
| Median | 2.8% | 3.0% |
| Interquartile 25% (IQ1) | 2.6% | 2.6% |
| Interquartile 75% (IQ3) | 3.2% | 3.4% |
| Interquartile Range (IQR) | 0.58% | 0.75% |
| Standard Deviation (Sample) | 2.3% | 1.5% |
| Standard Deviation (Population) | 2.2% | 1.5% |
Similar Demographics by Hearing Disability
Demographics Similar to Immigrants from Uruguay by Hearing Disability
In terms of hearing disability, the demographic groups most similar to Immigrants from Uruguay are Immigrants from Armenia (2.7%, a difference of 0.020%), Immigrants from Asia (2.7%, a difference of 0.030%), Immigrants from Cuba (2.7%, a difference of 0.030%), Colombian (2.7%, a difference of 0.21%), and Mongolian (2.7%, a difference of 0.23%).
| Demographics | Rating | Rank | Hearing Disability |
| Immigrants | Korea | 97.5 /100 | #74 | Exceptional 2.7% |
| Immigrants | Saudi Arabia | 97.5 /100 | #75 | Exceptional 2.7% |
| Asians | 97.5 /100 | #76 | Exceptional 2.7% |
| Immigrants | Malaysia | 97.5 /100 | #77 | Exceptional 2.7% |
| Mongolians | 97.4 /100 | #78 | Exceptional 2.7% |
| Colombians | 97.4 /100 | #79 | Exceptional 2.7% |
| Immigrants | Asia | 97.2 /100 | #80 | Exceptional 2.7% |
| Immigrants | Uruguay | 97.2 /100 | #81 | Exceptional 2.7% |
| Immigrants | Armenia | 97.2 /100 | #82 | Exceptional 2.7% |
| Immigrants | Cuba | 97.2 /100 | #83 | Exceptional 2.7% |
| Immigrants | Argentina | 97.0 /100 | #84 | Exceptional 2.8% |
| Immigrants | Northern Africa | 96.9 /100 | #85 | Exceptional 2.8% |
| Immigrants | Iran | 96.8 /100 | #86 | Exceptional 2.8% |
| Somalis | 96.7 /100 | #87 | Exceptional 2.8% |
| Immigrants | Turkey | 96.7 /100 | #88 | Exceptional 2.8% |
Demographics Similar to Albanians by Hearing Disability
In terms of hearing disability, the demographic groups most similar to Albanians are Immigrants from Japan (2.9%, a difference of 0.030%), Immigrants from Fiji (2.9%, a difference of 0.060%), Immigrants from Australia (2.9%, a difference of 0.090%), Immigrants from Central America (3.0%, a difference of 0.17%), and Immigrants from Cambodia (3.0%, a difference of 0.19%).
| Demographics | Rating | Rank | Hearing Disability |
| Immigrants | Lebanon | 71.5 /100 | #154 | Good 2.9% |
| Costa Ricans | 71.4 /100 | #155 | Good 2.9% |
| Immigrants | Poland | 70.2 /100 | #156 | Good 2.9% |
| Immigrants | Kazakhstan | 69.6 /100 | #157 | Good 2.9% |
| Immigrants | Burma/Myanmar | 69.5 /100 | #158 | Good 2.9% |
| Immigrants | Australia | 67.4 /100 | #159 | Good 2.9% |
| Immigrants | Fiji | 67.1 /100 | #160 | Good 2.9% |
| Albanians | 66.6 /100 | #161 | Good 2.9% |
| Immigrants | Japan | 66.3 /100 | #162 | Good 2.9% |
| Immigrants | Central America | 64.9 /100 | #163 | Good 3.0% |
| Immigrants | Cambodia | 64.8 /100 | #164 | Good 3.0% |
| Immigrants | Zimbabwe | 64.2 /100 | #165 | Good 3.0% |
| Immigrants | South Eastern Asia | 62.9 /100 | #166 | Good 3.0% |
| Immigrants | Eastern Europe | 58.1 /100 | #167 | Average 3.0% |
| Immigrants | Greece | 57.9 /100 | #168 | Average 3.0% |