Osage vs Albanian Hearing Disability
COMPARE
Osage
Albanian
Hearing Disability
Hearing Disability Comparison
Osage
Albanians
4.1%
HEARING DISABILITY
0.0/ 100
METRIC RATING
324th/ 347
METRIC RANK
2.9%
HEARING DISABILITY
66.6/ 100
METRIC RATING
161st/ 347
METRIC RANK
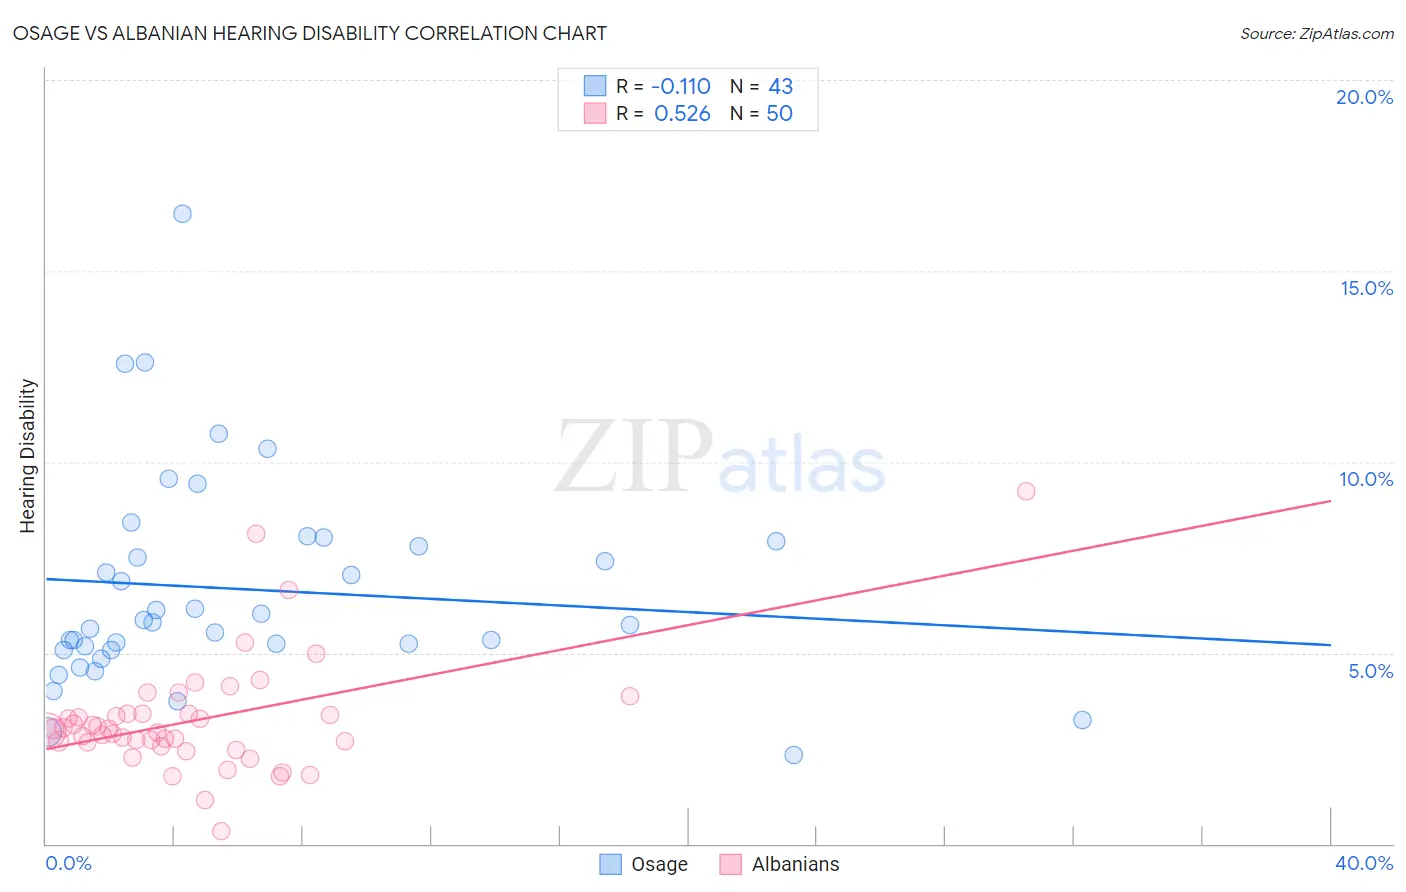
Osage vs Albanian Hearing Disability Correlation Chart
The statistical analysis conducted on geographies consisting of 91,798,863 people shows a poor negative correlation between the proportion of Osage and percentage of population with hearing disability in the United States with a correlation coefficient (R) of -0.110 and weighted average of 4.1%. Similarly, the statistical analysis conducted on geographies consisting of 193,249,073 people shows a substantial positive correlation between the proportion of Albanians and percentage of population with hearing disability in the United States with a correlation coefficient (R) of 0.526 and weighted average of 2.9%, a difference of 39.0%.
Hearing Disability Correlation Summary
| Measurement | Osage | Albanian |
| Minimum | 2.3% | 0.33% |
| Maximum | 16.5% | 9.2% |
| Range | 14.2% | 8.9% |
| Mean | 6.7% | 3.3% |
| Median | 5.8% | 3.0% |
| Interquartile 25% (IQ1) | 5.1% | 2.6% |
| Interquartile 75% (IQ3) | 7.9% | 3.4% |
| Interquartile Range (IQR) | 2.8% | 0.75% |
| Standard Deviation (Sample) | 2.8% | 1.5% |
| Standard Deviation (Population) | 2.8% | 1.5% |
Similar Demographics by Hearing Disability
Demographics Similar to Osage by Hearing Disability
In terms of hearing disability, the demographic groups most similar to Osage are Apache (4.1%, a difference of 0.070%), Seminole (4.1%, a difference of 0.19%), Lumbee (4.1%, a difference of 0.32%), Paiute (4.1%, a difference of 0.45%), and Potawatomi (4.1%, a difference of 0.61%).
| Demographics | Rating | Rank | Hearing Disability |
| Comanche | 0.0 /100 | #317 | Tragic 4.0% |
| Cheyenne | 0.0 /100 | #318 | Tragic 4.0% |
| Chippewa | 0.0 /100 | #319 | Tragic 4.0% |
| Shoshone | 0.0 /100 | #320 | Tragic 4.0% |
| Paiute | 0.0 /100 | #321 | Tragic 4.1% |
| Seminole | 0.0 /100 | #322 | Tragic 4.1% |
| Apache | 0.0 /100 | #323 | Tragic 4.1% |
| Osage | 0.0 /100 | #324 | Tragic 4.1% |
| Lumbee | 0.0 /100 | #325 | Tragic 4.1% |
| Potawatomi | 0.0 /100 | #326 | Tragic 4.1% |
| Arapaho | 0.0 /100 | #327 | Tragic 4.1% |
| Tohono O'odham | 0.0 /100 | #328 | Tragic 4.2% |
| Crow | 0.0 /100 | #329 | Tragic 4.2% |
| Natives/Alaskans | 0.0 /100 | #330 | Tragic 4.2% |
| Cherokee | 0.0 /100 | #331 | Tragic 4.2% |
Demographics Similar to Albanians by Hearing Disability
In terms of hearing disability, the demographic groups most similar to Albanians are Immigrants from Japan (2.9%, a difference of 0.030%), Immigrants from Fiji (2.9%, a difference of 0.060%), Immigrants from Australia (2.9%, a difference of 0.090%), Immigrants from Central America (3.0%, a difference of 0.17%), and Immigrants from Cambodia (3.0%, a difference of 0.19%).
| Demographics | Rating | Rank | Hearing Disability |
| Immigrants | Lebanon | 71.5 /100 | #154 | Good 2.9% |
| Costa Ricans | 71.4 /100 | #155 | Good 2.9% |
| Immigrants | Poland | 70.2 /100 | #156 | Good 2.9% |
| Immigrants | Kazakhstan | 69.6 /100 | #157 | Good 2.9% |
| Immigrants | Burma/Myanmar | 69.5 /100 | #158 | Good 2.9% |
| Immigrants | Australia | 67.4 /100 | #159 | Good 2.9% |
| Immigrants | Fiji | 67.1 /100 | #160 | Good 2.9% |
| Albanians | 66.6 /100 | #161 | Good 2.9% |
| Immigrants | Japan | 66.3 /100 | #162 | Good 2.9% |
| Immigrants | Central America | 64.9 /100 | #163 | Good 3.0% |
| Immigrants | Cambodia | 64.8 /100 | #164 | Good 3.0% |
| Immigrants | Zimbabwe | 64.2 /100 | #165 | Good 3.0% |
| Immigrants | South Eastern Asia | 62.9 /100 | #166 | Good 3.0% |
| Immigrants | Eastern Europe | 58.1 /100 | #167 | Average 3.0% |
| Immigrants | Greece | 57.9 /100 | #168 | Average 3.0% |