Immigrants from Dominican Republic vs Albanian Hearing Disability
COMPARE
Immigrants from Dominican Republic
Albanian
Hearing Disability
Hearing Disability Comparison
Immigrants from Dominican Republic
Albanians
2.4%
HEARING DISABILITY
100.0/ 100
METRIC RATING
9th/ 347
METRIC RANK
2.9%
HEARING DISABILITY
66.6/ 100
METRIC RATING
161st/ 347
METRIC RANK
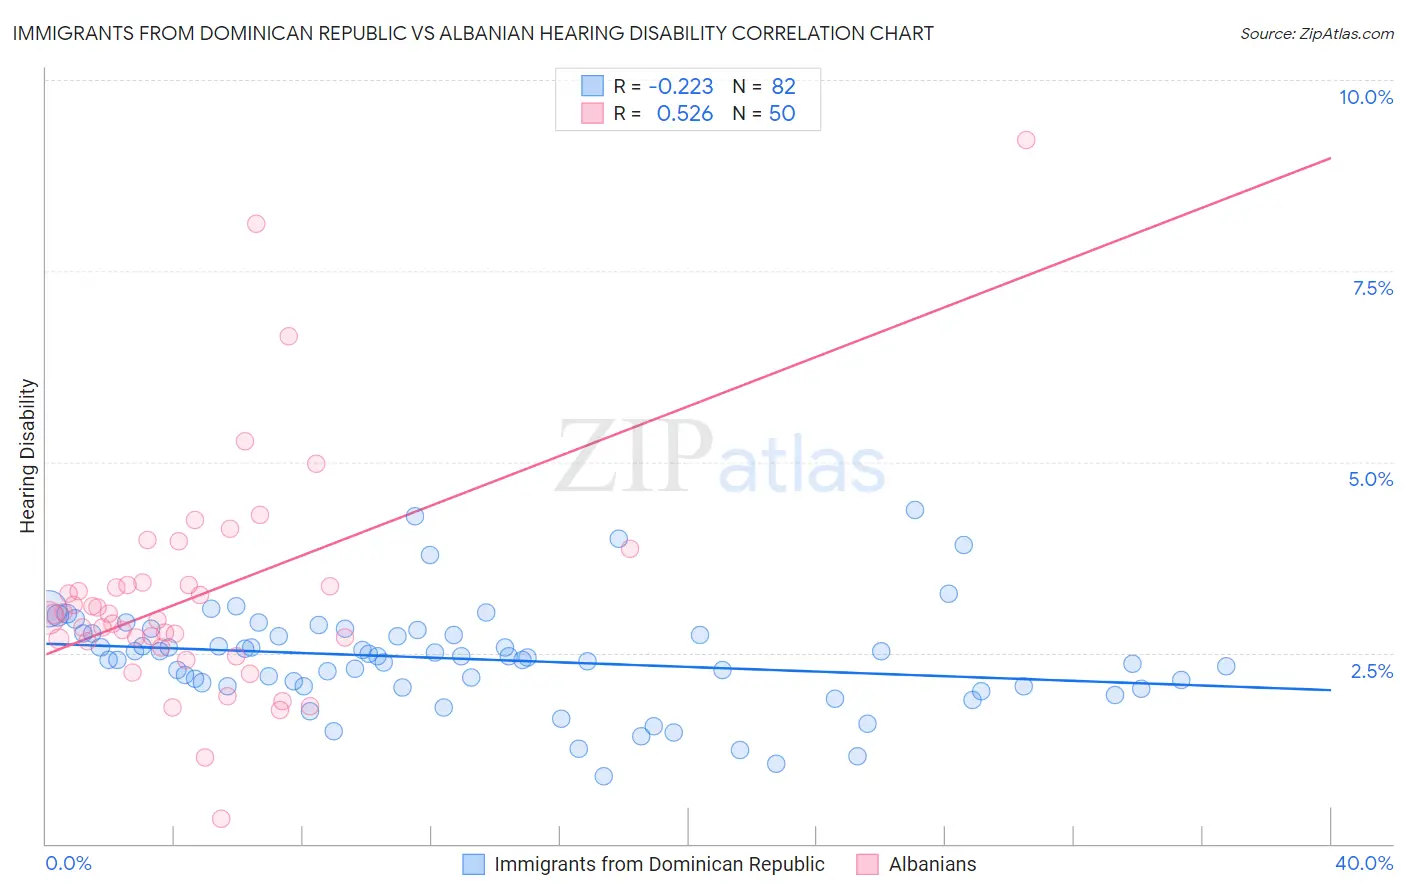
Immigrants from Dominican Republic vs Albanian Hearing Disability Correlation Chart
The statistical analysis conducted on geographies consisting of 275,054,996 people shows a weak negative correlation between the proportion of Immigrants from Dominican Republic and percentage of population with hearing disability in the United States with a correlation coefficient (R) of -0.223 and weighted average of 2.4%. Similarly, the statistical analysis conducted on geographies consisting of 193,249,073 people shows a substantial positive correlation between the proportion of Albanians and percentage of population with hearing disability in the United States with a correlation coefficient (R) of 0.526 and weighted average of 2.9%, a difference of 20.3%.
Hearing Disability Correlation Summary
| Measurement | Immigrants from Dominican Republic | Albanian |
| Minimum | 0.89% | 0.33% |
| Maximum | 4.4% | 9.2% |
| Range | 3.5% | 8.9% |
| Mean | 2.4% | 3.3% |
| Median | 2.4% | 3.0% |
| Interquartile 25% (IQ1) | 2.1% | 2.6% |
| Interquartile 75% (IQ3) | 2.8% | 3.4% |
| Interquartile Range (IQR) | 0.69% | 0.75% |
| Standard Deviation (Sample) | 0.66% | 1.5% |
| Standard Deviation (Population) | 0.66% | 1.5% |
Similar Demographics by Hearing Disability
Demographics Similar to Immigrants from Dominican Republic by Hearing Disability
In terms of hearing disability, the demographic groups most similar to Immigrants from Dominican Republic are British West Indian (2.4%, a difference of 0.78%), Immigrants from Bangladesh (2.4%, a difference of 1.0%), Immigrants from Ecuador (2.5%, a difference of 1.0%), Immigrants from Trinidad and Tobago (2.5%, a difference of 1.6%), and Trinidadian and Tobagonian (2.5%, a difference of 1.9%).
| Demographics | Rating | Rank | Hearing Disability |
| Immigrants | St. Vincent and the Grenadines | 100.0 /100 | #2 | Exceptional 2.3% |
| Guyanese | 100.0 /100 | #3 | Exceptional 2.3% |
| Immigrants | Guyana | 100.0 /100 | #4 | Exceptional 2.3% |
| Immigrants | Barbados | 100.0 /100 | #5 | Exceptional 2.4% |
| Vietnamese | 100.0 /100 | #6 | Exceptional 2.4% |
| Immigrants | Bangladesh | 100.0 /100 | #7 | Exceptional 2.4% |
| British West Indians | 100.0 /100 | #8 | Exceptional 2.4% |
| Immigrants | Dominican Republic | 100.0 /100 | #9 | Exceptional 2.4% |
| Immigrants | Ecuador | 99.9 /100 | #10 | Exceptional 2.5% |
| Immigrants | Trinidad and Tobago | 99.9 /100 | #11 | Exceptional 2.5% |
| Trinidadians and Tobagonians | 99.9 /100 | #12 | Exceptional 2.5% |
| Sierra Leoneans | 99.9 /100 | #13 | Exceptional 2.5% |
| Ecuadorians | 99.9 /100 | #14 | Exceptional 2.5% |
| Barbadians | 99.9 /100 | #15 | Exceptional 2.5% |
| Immigrants | West Indies | 99.9 /100 | #16 | Exceptional 2.5% |
Demographics Similar to Albanians by Hearing Disability
In terms of hearing disability, the demographic groups most similar to Albanians are Immigrants from Japan (2.9%, a difference of 0.030%), Immigrants from Fiji (2.9%, a difference of 0.060%), Immigrants from Australia (2.9%, a difference of 0.090%), Immigrants from Central America (3.0%, a difference of 0.17%), and Immigrants from Cambodia (3.0%, a difference of 0.19%).
| Demographics | Rating | Rank | Hearing Disability |
| Immigrants | Lebanon | 71.5 /100 | #154 | Good 2.9% |
| Costa Ricans | 71.4 /100 | #155 | Good 2.9% |
| Immigrants | Poland | 70.2 /100 | #156 | Good 2.9% |
| Immigrants | Kazakhstan | 69.6 /100 | #157 | Good 2.9% |
| Immigrants | Burma/Myanmar | 69.5 /100 | #158 | Good 2.9% |
| Immigrants | Australia | 67.4 /100 | #159 | Good 2.9% |
| Immigrants | Fiji | 67.1 /100 | #160 | Good 2.9% |
| Albanians | 66.6 /100 | #161 | Good 2.9% |
| Immigrants | Japan | 66.3 /100 | #162 | Good 2.9% |
| Immigrants | Central America | 64.9 /100 | #163 | Good 3.0% |
| Immigrants | Cambodia | 64.8 /100 | #164 | Good 3.0% |
| Immigrants | Zimbabwe | 64.2 /100 | #165 | Good 3.0% |
| Immigrants | South Eastern Asia | 62.9 /100 | #166 | Good 3.0% |
| Immigrants | Eastern Europe | 58.1 /100 | #167 | Average 3.0% |
| Immigrants | Greece | 57.9 /100 | #168 | Average 3.0% |