Fijian vs Immigrants from Singapore Disability
COMPARE
Fijian
Immigrants from Singapore
Disability
Disability Comparison
Fijians
Immigrants from Singapore
12.8%
DISABILITY
0.0/ 100
METRIC RATING
279th/ 347
METRIC RANK
10.0%
DISABILITY
100.0/ 100
METRIC RATING
7th/ 347
METRIC RANK
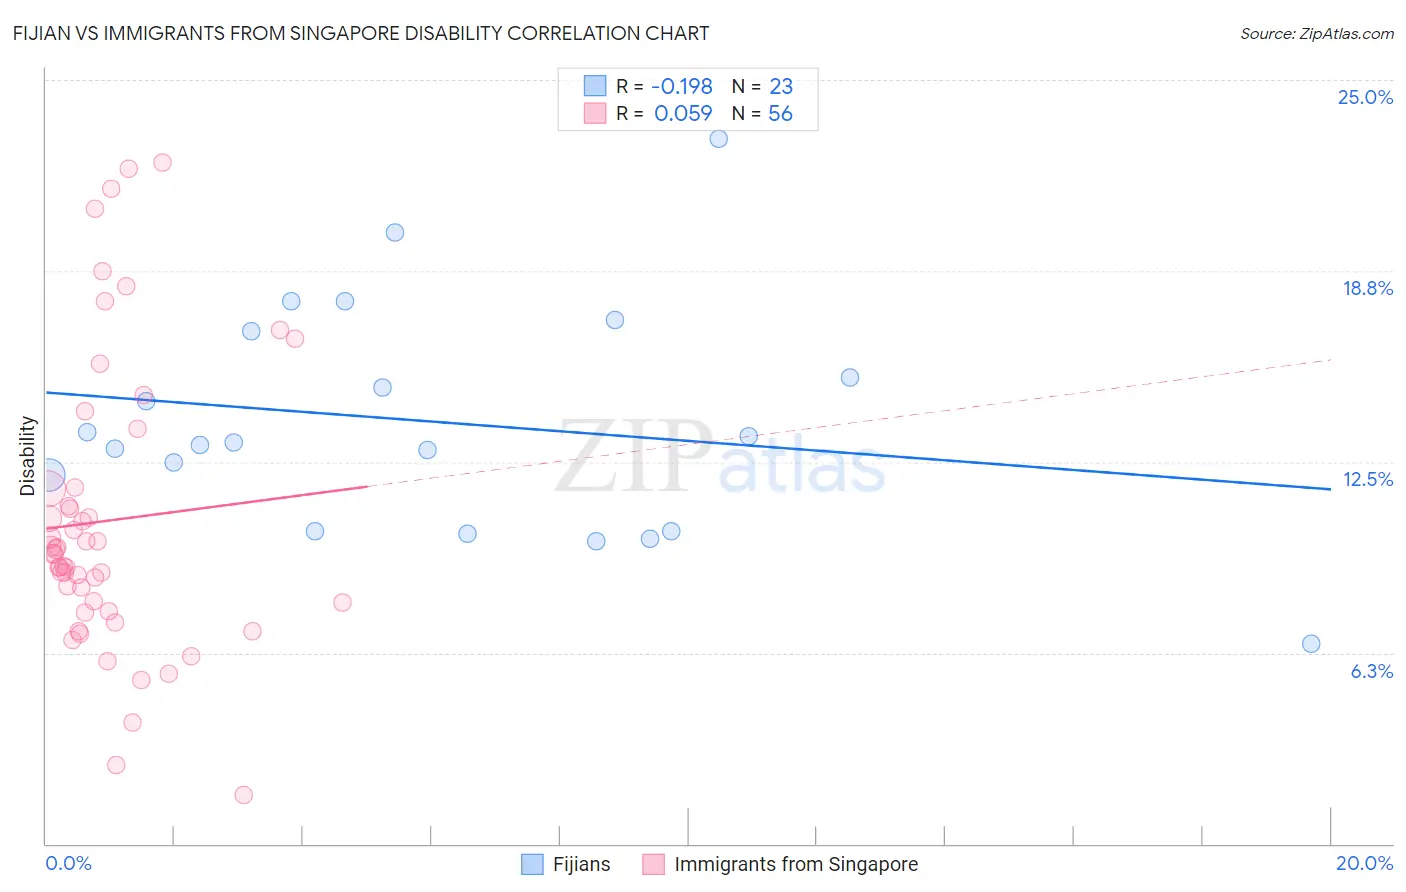
Fijian vs Immigrants from Singapore Disability Correlation Chart
The statistical analysis conducted on geographies consisting of 55,947,896 people shows a poor negative correlation between the proportion of Fijians and percentage of population with a disability in the United States with a correlation coefficient (R) of -0.198 and weighted average of 12.8%. Similarly, the statistical analysis conducted on geographies consisting of 137,520,897 people shows a slight positive correlation between the proportion of Immigrants from Singapore and percentage of population with a disability in the United States with a correlation coefficient (R) of 0.059 and weighted average of 10.0%, a difference of 28.6%.
Disability Correlation Summary
| Measurement | Fijian | Immigrants from Singapore |
| Minimum | 6.6% | 1.6% |
| Maximum | 23.1% | 22.3% |
| Range | 16.5% | 20.7% |
| Mean | 13.8% | 10.6% |
| Median | 13.1% | 9.5% |
| Interquartile 25% (IQ1) | 10.2% | 7.7% |
| Interquartile 75% (IQ3) | 16.8% | 11.6% |
| Interquartile Range (IQR) | 6.5% | 3.9% |
| Standard Deviation (Sample) | 3.7% | 4.7% |
| Standard Deviation (Population) | 3.7% | 4.7% |
Similar Demographics by Disability
Demographics Similar to Fijians by Disability
In terms of disability, the demographic groups most similar to Fijians are Spanish (12.8%, a difference of 0.050%), German (12.8%, a difference of 0.090%), Immigrants from Portugal (12.9%, a difference of 0.19%), Dutch (12.8%, a difference of 0.26%), and Hmong (12.8%, a difference of 0.31%).
| Demographics | Rating | Rank | Disability |
| Dominicans | 0.0 /100 | #272 | Tragic 12.7% |
| Finns | 0.0 /100 | #273 | Tragic 12.7% |
| Nepalese | 0.0 /100 | #274 | Tragic 12.8% |
| Sioux | 0.0 /100 | #275 | Tragic 12.8% |
| Hmong | 0.0 /100 | #276 | Tragic 12.8% |
| Dutch | 0.0 /100 | #277 | Tragic 12.8% |
| Germans | 0.0 /100 | #278 | Tragic 12.8% |
| Fijians | 0.0 /100 | #279 | Tragic 12.8% |
| Spanish | 0.0 /100 | #280 | Tragic 12.8% |
| Immigrants | Portugal | 0.0 /100 | #281 | Tragic 12.9% |
| Scottish | 0.0 /100 | #282 | Tragic 12.9% |
| Irish | 0.0 /100 | #283 | Tragic 12.9% |
| Welsh | 0.0 /100 | #284 | Tragic 12.9% |
| Crow | 0.0 /100 | #285 | Tragic 12.9% |
| English | 0.0 /100 | #286 | Tragic 13.0% |
Demographics Similar to Immigrants from Singapore by Disability
In terms of disability, the demographic groups most similar to Immigrants from Singapore are Bolivian (10.0%, a difference of 0.23%), Immigrants from South Central Asia (9.9%, a difference of 0.31%), Immigrants from Hong Kong (10.0%, a difference of 0.52%), Immigrants from Bolivia (9.9%, a difference of 1.2%), and Immigrants from China (10.1%, a difference of 1.3%).
| Demographics | Rating | Rank | Disability |
| Immigrants | India | 100.0 /100 | #1 | Exceptional 9.5% |
| Filipinos | 100.0 /100 | #2 | Exceptional 9.6% |
| Immigrants | Taiwan | 100.0 /100 | #3 | Exceptional 9.6% |
| Thais | 100.0 /100 | #4 | Exceptional 9.7% |
| Immigrants | Bolivia | 100.0 /100 | #5 | Exceptional 9.9% |
| Immigrants | South Central Asia | 100.0 /100 | #6 | Exceptional 9.9% |
| Immigrants | Singapore | 100.0 /100 | #7 | Exceptional 10.0% |
| Bolivians | 100.0 /100 | #8 | Exceptional 10.0% |
| Immigrants | Hong Kong | 100.0 /100 | #9 | Exceptional 10.0% |
| Immigrants | China | 100.0 /100 | #10 | Exceptional 10.1% |
| Iranians | 100.0 /100 | #11 | Exceptional 10.1% |
| Immigrants | Israel | 100.0 /100 | #12 | Exceptional 10.1% |
| Immigrants | Eastern Asia | 100.0 /100 | #13 | Exceptional 10.2% |
| Immigrants | Korea | 100.0 /100 | #14 | Exceptional 10.2% |
| Okinawans | 100.0 /100 | #15 | Exceptional 10.3% |