Fijian vs Tohono O'odham Disability
COMPARE
Fijian
Tohono O'odham
Disability
Disability Comparison
Fijians
Tohono O'odham
12.8%
DISABILITY
0.0/ 100
METRIC RATING
279th/ 347
METRIC RANK
14.8%
DISABILITY
0.0/ 100
METRIC RATING
335th/ 347
METRIC RANK
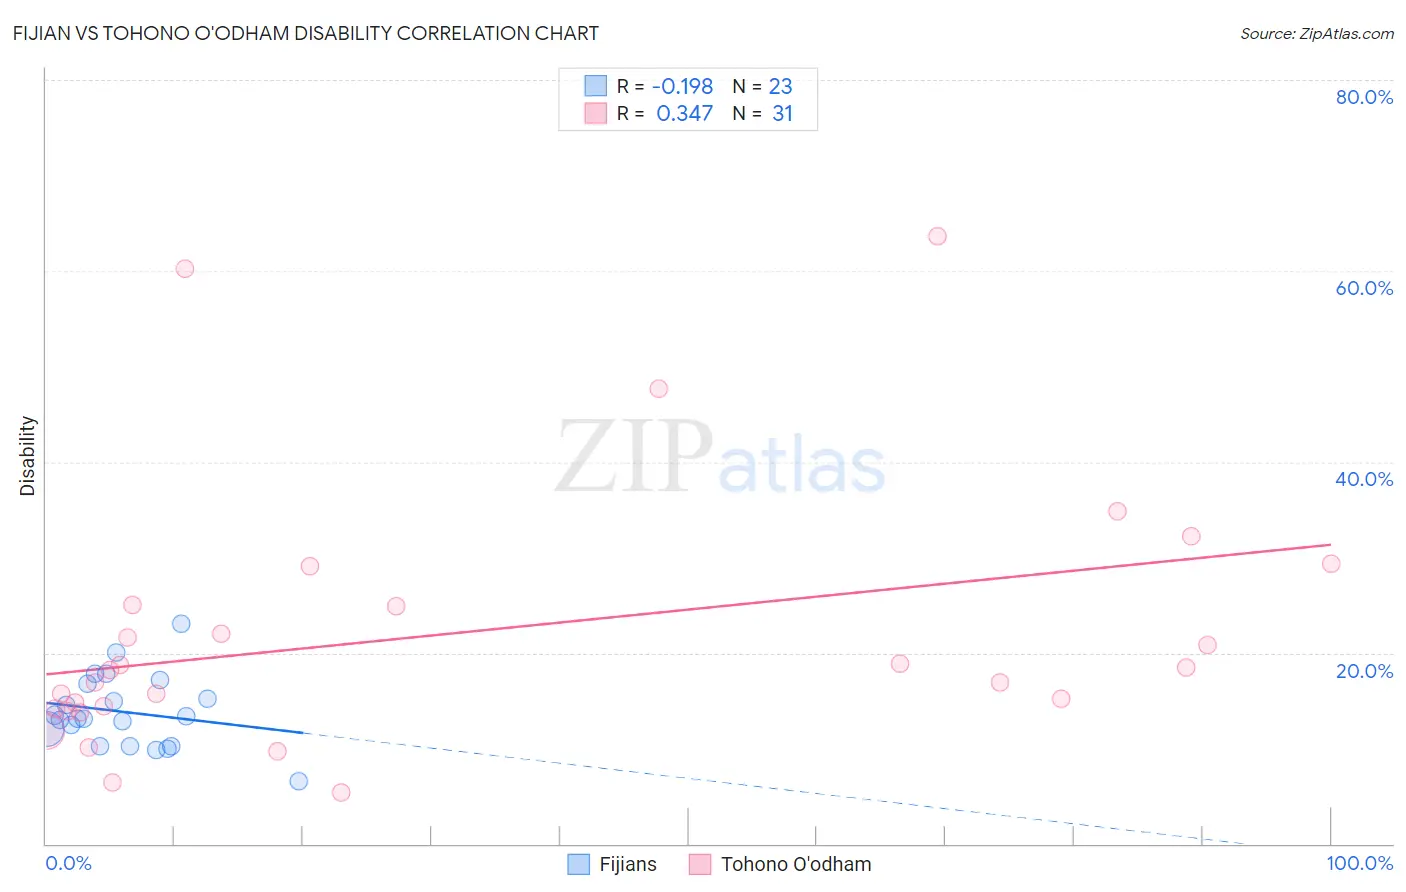
Fijian vs Tohono O'odham Disability Correlation Chart
The statistical analysis conducted on geographies consisting of 55,947,896 people shows a poor negative correlation between the proportion of Fijians and percentage of population with a disability in the United States with a correlation coefficient (R) of -0.198 and weighted average of 12.8%. Similarly, the statistical analysis conducted on geographies consisting of 58,721,793 people shows a mild positive correlation between the proportion of Tohono O'odham and percentage of population with a disability in the United States with a correlation coefficient (R) of 0.347 and weighted average of 14.8%, a difference of 15.0%.
Disability Correlation Summary
| Measurement | Fijian | Tohono O'odham |
| Minimum | 6.6% | 5.4% |
| Maximum | 23.1% | 63.6% |
| Range | 16.5% | 58.3% |
| Mean | 13.8% | 21.9% |
| Median | 13.1% | 18.2% |
| Interquartile 25% (IQ1) | 10.2% | 14.1% |
| Interquartile 75% (IQ3) | 16.8% | 25.0% |
| Interquartile Range (IQR) | 6.5% | 10.9% |
| Standard Deviation (Sample) | 3.7% | 13.8% |
| Standard Deviation (Population) | 3.7% | 13.5% |
Similar Demographics by Disability
Demographics Similar to Fijians by Disability
In terms of disability, the demographic groups most similar to Fijians are Spanish (12.8%, a difference of 0.050%), German (12.8%, a difference of 0.090%), Immigrants from Portugal (12.9%, a difference of 0.19%), Dutch (12.8%, a difference of 0.26%), and Hmong (12.8%, a difference of 0.31%).
| Demographics | Rating | Rank | Disability |
| Dominicans | 0.0 /100 | #272 | Tragic 12.7% |
| Finns | 0.0 /100 | #273 | Tragic 12.7% |
| Nepalese | 0.0 /100 | #274 | Tragic 12.8% |
| Sioux | 0.0 /100 | #275 | Tragic 12.8% |
| Hmong | 0.0 /100 | #276 | Tragic 12.8% |
| Dutch | 0.0 /100 | #277 | Tragic 12.8% |
| Germans | 0.0 /100 | #278 | Tragic 12.8% |
| Fijians | 0.0 /100 | #279 | Tragic 12.8% |
| Spanish | 0.0 /100 | #280 | Tragic 12.8% |
| Immigrants | Portugal | 0.0 /100 | #281 | Tragic 12.9% |
| Scottish | 0.0 /100 | #282 | Tragic 12.9% |
| Irish | 0.0 /100 | #283 | Tragic 12.9% |
| Welsh | 0.0 /100 | #284 | Tragic 12.9% |
| Crow | 0.0 /100 | #285 | Tragic 12.9% |
| English | 0.0 /100 | #286 | Tragic 13.0% |
Demographics Similar to Tohono O'odham by Disability
In terms of disability, the demographic groups most similar to Tohono O'odham are Cherokee (14.8%, a difference of 0.51%), Seminole (14.9%, a difference of 0.61%), Dutch West Indian (14.9%, a difference of 0.91%), Yuman (14.6%, a difference of 1.0%), and Cajun (14.6%, a difference of 1.2%).
| Demographics | Rating | Rank | Disability |
| Immigrants | Azores | 0.0 /100 | #328 | Tragic 14.2% |
| Potawatomi | 0.0 /100 | #329 | Tragic 14.2% |
| Navajo | 0.0 /100 | #330 | Tragic 14.3% |
| Alaskan Athabascans | 0.0 /100 | #331 | Tragic 14.4% |
| Pueblo | 0.0 /100 | #332 | Tragic 14.4% |
| Cajuns | 0.0 /100 | #333 | Tragic 14.6% |
| Yuman | 0.0 /100 | #334 | Tragic 14.6% |
| Tohono O'odham | 0.0 /100 | #335 | Tragic 14.8% |
| Cherokee | 0.0 /100 | #336 | Tragic 14.8% |
| Seminole | 0.0 /100 | #337 | Tragic 14.9% |
| Dutch West Indians | 0.0 /100 | #338 | Tragic 14.9% |
| Chickasaw | 0.0 /100 | #339 | Tragic 15.2% |
| Choctaw | 0.0 /100 | #340 | Tragic 15.4% |
| Lumbee | 0.0 /100 | #341 | Tragic 15.5% |
| Kiowa | 0.0 /100 | #342 | Tragic 15.6% |