Fijian vs Immigrants from Middle Africa Disability
COMPARE
Fijian
Immigrants from Middle Africa
Disability
Disability Comparison
Fijians
Immigrants from Middle Africa
12.8%
DISABILITY
0.0/ 100
METRIC RATING
279th/ 347
METRIC RANK
11.6%
DISABILITY
69.5/ 100
METRIC RATING
157th/ 347
METRIC RANK
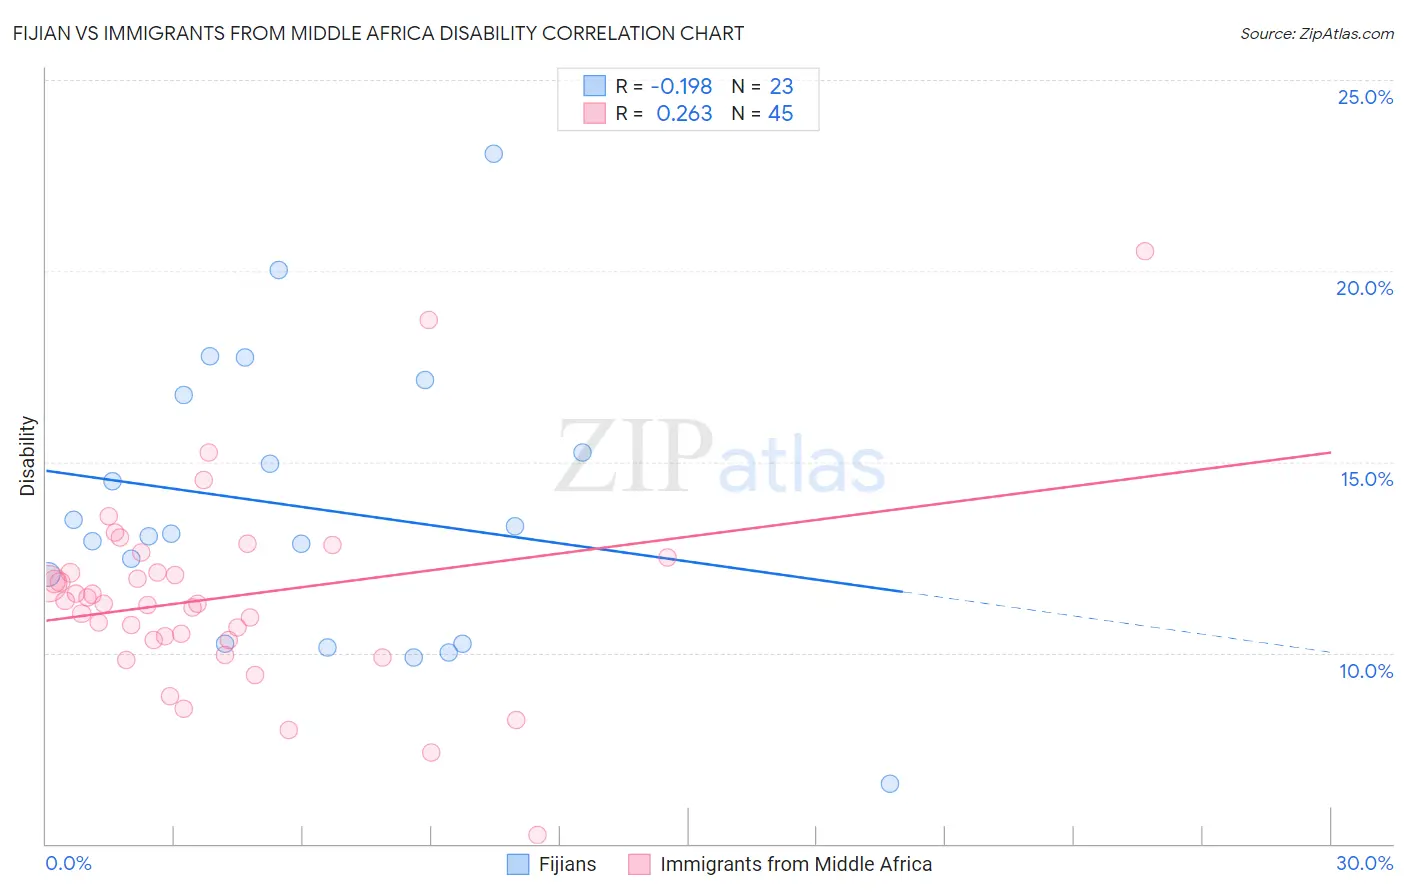
Fijian vs Immigrants from Middle Africa Disability Correlation Chart
The statistical analysis conducted on geographies consisting of 55,947,896 people shows a poor negative correlation between the proportion of Fijians and percentage of population with a disability in the United States with a correlation coefficient (R) of -0.198 and weighted average of 12.8%. Similarly, the statistical analysis conducted on geographies consisting of 202,728,715 people shows a weak positive correlation between the proportion of Immigrants from Middle Africa and percentage of population with a disability in the United States with a correlation coefficient (R) of 0.263 and weighted average of 11.6%, a difference of 10.7%.
Disability Correlation Summary
| Measurement | Fijian | Immigrants from Middle Africa |
| Minimum | 6.6% | 5.2% |
| Maximum | 23.1% | 20.5% |
| Range | 16.5% | 15.3% |
| Mean | 13.8% | 11.4% |
| Median | 13.1% | 11.3% |
| Interquartile 25% (IQ1) | 10.2% | 10.3% |
| Interquartile 75% (IQ3) | 16.8% | 12.3% |
| Interquartile Range (IQR) | 6.5% | 2.0% |
| Standard Deviation (Sample) | 3.7% | 2.6% |
| Standard Deviation (Population) | 3.7% | 2.5% |
Similar Demographics by Disability
Demographics Similar to Fijians by Disability
In terms of disability, the demographic groups most similar to Fijians are Spanish (12.8%, a difference of 0.050%), German (12.8%, a difference of 0.090%), Immigrants from Portugal (12.9%, a difference of 0.19%), Dutch (12.8%, a difference of 0.26%), and Hmong (12.8%, a difference of 0.31%).
| Demographics | Rating | Rank | Disability |
| Dominicans | 0.0 /100 | #272 | Tragic 12.7% |
| Finns | 0.0 /100 | #273 | Tragic 12.7% |
| Nepalese | 0.0 /100 | #274 | Tragic 12.8% |
| Sioux | 0.0 /100 | #275 | Tragic 12.8% |
| Hmong | 0.0 /100 | #276 | Tragic 12.8% |
| Dutch | 0.0 /100 | #277 | Tragic 12.8% |
| Germans | 0.0 /100 | #278 | Tragic 12.8% |
| Fijians | 0.0 /100 | #279 | Tragic 12.8% |
| Spanish | 0.0 /100 | #280 | Tragic 12.8% |
| Immigrants | Portugal | 0.0 /100 | #281 | Tragic 12.9% |
| Scottish | 0.0 /100 | #282 | Tragic 12.9% |
| Irish | 0.0 /100 | #283 | Tragic 12.9% |
| Welsh | 0.0 /100 | #284 | Tragic 12.9% |
| Crow | 0.0 /100 | #285 | Tragic 12.9% |
| English | 0.0 /100 | #286 | Tragic 13.0% |
Demographics Similar to Immigrants from Middle Africa by Disability
In terms of disability, the demographic groups most similar to Immigrants from Middle Africa are Immigrants from Fiji (11.6%, a difference of 0.0%), Immigrants from Netherlands (11.6%, a difference of 0.020%), Immigrants from Ghana (11.6%, a difference of 0.090%), Immigrants from Guatemala (11.6%, a difference of 0.090%), and Immigrants from Kenya (11.6%, a difference of 0.14%).
| Demographics | Rating | Rank | Disability |
| Romanians | 72.7 /100 | #150 | Good 11.6% |
| Immigrants | Kenya | 72.1 /100 | #151 | Good 11.6% |
| Immigrants | Moldova | 72.0 /100 | #152 | Good 11.6% |
| Immigrants | Ghana | 71.2 /100 | #153 | Good 11.6% |
| Immigrants | Guatemala | 71.1 /100 | #154 | Good 11.6% |
| Immigrants | Netherlands | 69.8 /100 | #155 | Good 11.6% |
| Immigrants | Fiji | 69.5 /100 | #156 | Good 11.6% |
| Immigrants | Middle Africa | 69.5 /100 | #157 | Good 11.6% |
| Armenians | 65.9 /100 | #158 | Good 11.6% |
| Guatemalans | 65.1 /100 | #159 | Good 11.6% |
| Immigrants | Barbados | 64.2 /100 | #160 | Good 11.6% |
| Immigrants | Cuba | 62.8 /100 | #161 | Good 11.6% |
| Immigrants | Haiti | 59.2 /100 | #162 | Average 11.7% |
| Immigrants | Trinidad and Tobago | 58.9 /100 | #163 | Average 11.7% |
| Syrians | 58.5 /100 | #164 | Average 11.7% |