Immigrants from Western Europe vs Czech Male Disability
COMPARE
Immigrants from Western Europe
Czech
Male Disability
Male Disability Comparison
Immigrants from Western Europe
Czechs
11.7%
MALE DISABILITY
3.8/ 100
METRIC RATING
220th/ 347
METRIC RANK
11.9%
MALE DISABILITY
1.1/ 100
METRIC RATING
240th/ 347
METRIC RANK
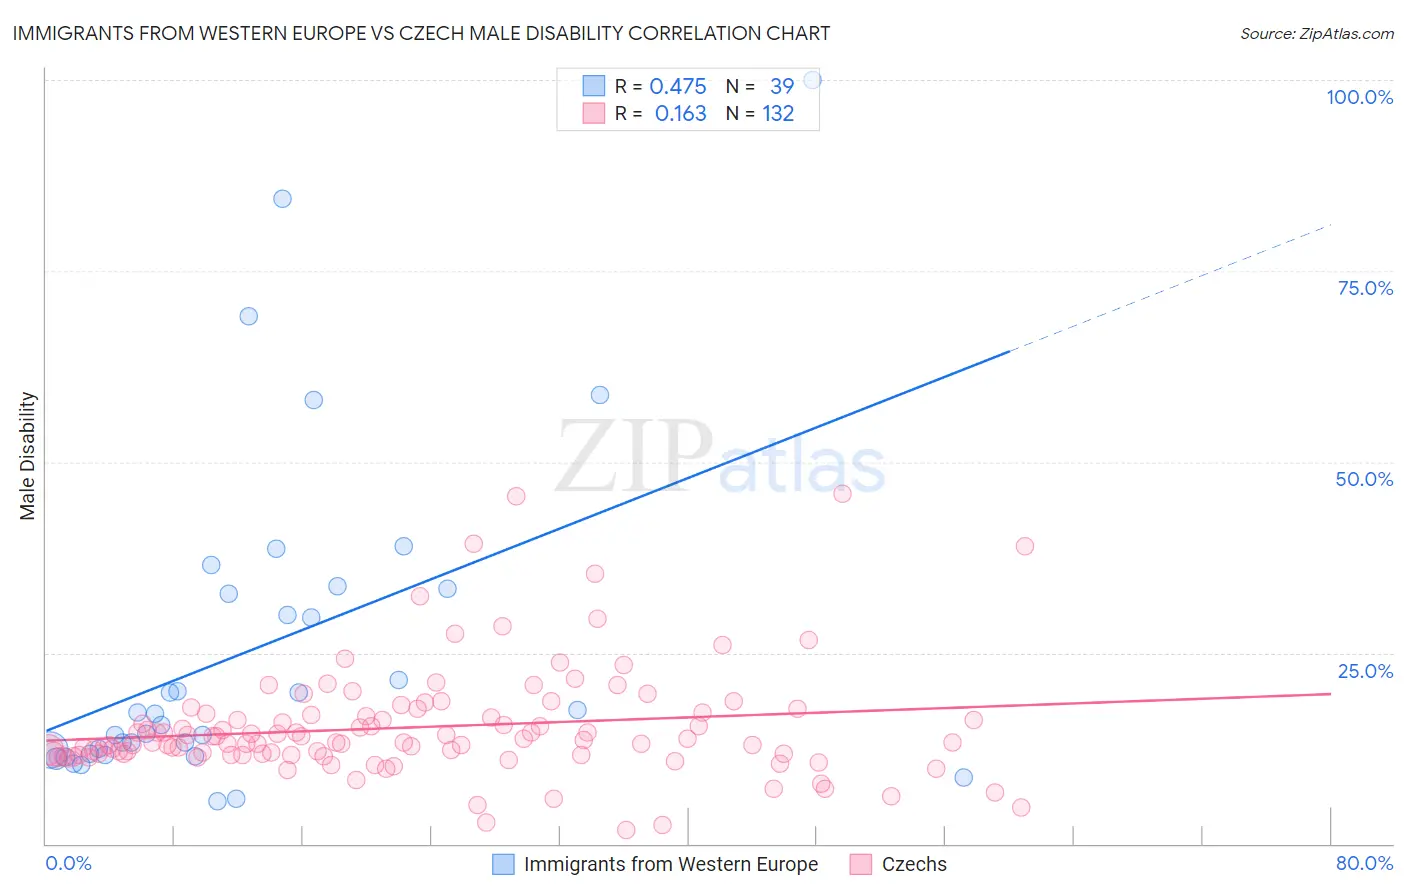
Immigrants from Western Europe vs Czech Male Disability Correlation Chart
The statistical analysis conducted on geographies consisting of 494,010,238 people shows a moderate positive correlation between the proportion of Immigrants from Western Europe and percentage of males with a disability in the United States with a correlation coefficient (R) of 0.475 and weighted average of 11.7%. Similarly, the statistical analysis conducted on geographies consisting of 484,720,527 people shows a poor positive correlation between the proportion of Czechs and percentage of males with a disability in the United States with a correlation coefficient (R) of 0.163 and weighted average of 11.9%, a difference of 1.6%.
Male Disability Correlation Summary
| Measurement | Immigrants from Western Europe | Czech |
| Minimum | 5.5% | 1.8% |
| Maximum | 100.0% | 45.8% |
| Range | 94.5% | 44.0% |
| Mean | 25.6% | 15.3% |
| Median | 17.1% | 13.3% |
| Interquartile 25% (IQ1) | 11.8% | 11.6% |
| Interquartile 75% (IQ3) | 33.3% | 16.9% |
| Interquartile Range (IQR) | 21.6% | 5.3% |
| Standard Deviation (Sample) | 21.7% | 7.2% |
| Standard Deviation (Population) | 21.4% | 7.2% |
Demographics Similar to Immigrants from Western Europe and Czechs by Male Disability
In terms of male disability, the demographic groups most similar to Immigrants from Western Europe are Immigrants from Congo (11.7%, a difference of 0.010%), Alsatian (11.7%, a difference of 0.17%), Immigrants from Bahamas (11.7%, a difference of 0.25%), Japanese (11.7%, a difference of 0.27%), and Liberian (11.8%, a difference of 0.28%). Similarly, the demographic groups most similar to Czechs are Italian (11.9%, a difference of 0.050%), Yugoslavian (11.9%, a difference of 0.10%), Carpatho Rusyn (11.9%, a difference of 0.20%), U.S. Virgin Islander (11.9%, a difference of 0.21%), and Immigrants from North America (11.9%, a difference of 0.35%).
| Demographics | Rating | Rank | Male Disability |
| Immigrants | Western Europe | 3.8 /100 | #220 | Tragic 11.7% |
| Immigrants | Congo | 3.7 /100 | #221 | Tragic 11.7% |
| Alsatians | 3.3 /100 | #222 | Tragic 11.7% |
| Immigrants | Bahamas | 3.2 /100 | #223 | Tragic 11.7% |
| Japanese | 3.1 /100 | #224 | Tragic 11.7% |
| Liberians | 3.1 /100 | #225 | Tragic 11.8% |
| Sub-Saharan Africans | 2.8 /100 | #226 | Tragic 11.8% |
| Austrians | 2.5 /100 | #227 | Tragic 11.8% |
| Hispanics or Latinos | 2.3 /100 | #228 | Tragic 11.8% |
| Bermudans | 2.3 /100 | #229 | Tragic 11.8% |
| Croatians | 2.1 /100 | #230 | Tragic 11.8% |
| Dominicans | 1.8 /100 | #231 | Tragic 11.8% |
| Malaysians | 1.8 /100 | #232 | Tragic 11.8% |
| Mexicans | 1.7 /100 | #233 | Tragic 11.8% |
| Immigrants | Canada | 1.6 /100 | #234 | Tragic 11.9% |
| Immigrants | North America | 1.5 /100 | #235 | Tragic 11.9% |
| U.S. Virgin Islanders | 1.3 /100 | #236 | Tragic 11.9% |
| Carpatho Rusyns | 1.3 /100 | #237 | Tragic 11.9% |
| Yugoslavians | 1.2 /100 | #238 | Tragic 11.9% |
| Italians | 1.2 /100 | #239 | Tragic 11.9% |
| Czechs | 1.1 /100 | #240 | Tragic 11.9% |