English vs Czech In Labor Force | Age 45-54
COMPARE
English
Czech
In Labor Force | Age 45-54
In Labor Force | Age 45-54 Comparison
English
Czechs
82.2%
IN LABOR FORCE | AGE 45-54
4.4/ 100
METRIC RATING
218th/ 347
METRIC RANK
83.9%
IN LABOR FORCE | AGE 45-54
99.8/ 100
METRIC RATING
19th/ 347
METRIC RANK
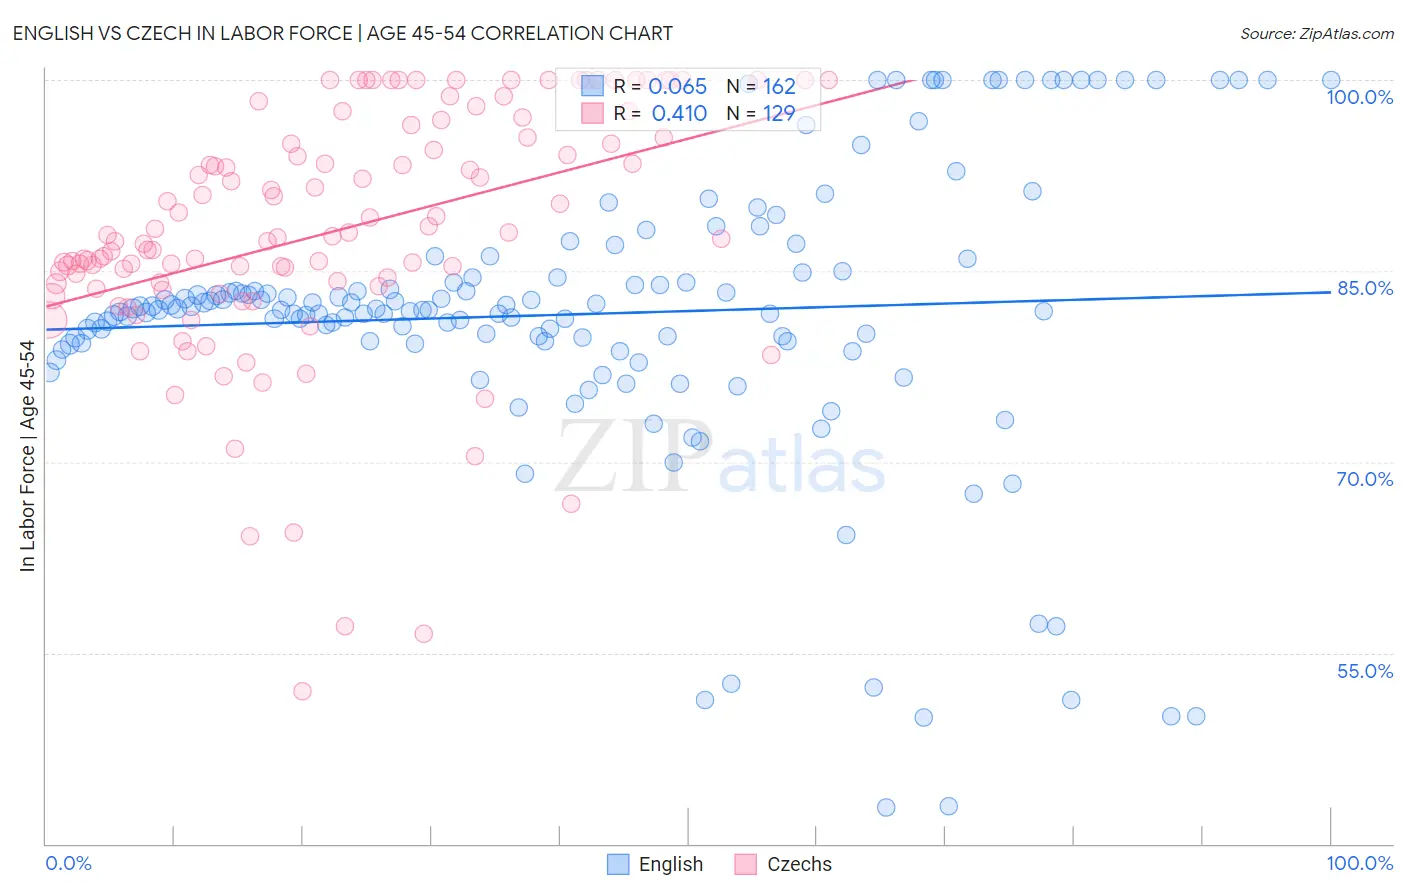
English vs Czech In Labor Force | Age 45-54 Correlation Chart
The statistical analysis conducted on geographies consisting of 578,921,090 people shows a slight positive correlation between the proportion of English and labor force participation rate among population between the ages 45 and 54 in the United States with a correlation coefficient (R) of 0.065 and weighted average of 82.2%. Similarly, the statistical analysis conducted on geographies consisting of 484,423,200 people shows a moderate positive correlation between the proportion of Czechs and labor force participation rate among population between the ages 45 and 54 in the United States with a correlation coefficient (R) of 0.410 and weighted average of 83.9%, a difference of 2.1%.
In Labor Force | Age 45-54 Correlation Summary
| Measurement | English | Czech |
| Minimum | 42.8% | 51.9% |
| Maximum | 100.0% | 100.0% |
| Range | 57.2% | 48.1% |
| Mean | 81.6% | 88.1% |
| Median | 81.9% | 87.6% |
| Interquartile 25% (IQ1) | 79.5% | 83.9% |
| Interquartile 75% (IQ3) | 84.5% | 95.5% |
| Interquartile Range (IQR) | 5.1% | 11.6% |
| Standard Deviation (Sample) | 11.3% | 9.7% |
| Standard Deviation (Population) | 11.3% | 9.6% |
Similar Demographics by In Labor Force | Age 45-54
Demographics Similar to English by In Labor Force | Age 45-54
In terms of in labor force | age 45-54, the demographic groups most similar to English are French (82.2%, a difference of 0.010%), Portuguese (82.2%, a difference of 0.020%), Scottish (82.2%, a difference of 0.040%), Bahamian (82.2%, a difference of 0.050%), and Panamanian (82.2%, a difference of 0.050%).
| Demographics | Rating | Rank | In Labor Force | Age 45-54 |
| Immigrants | Syria | 6.6 /100 | #211 | Tragic 82.3% |
| Ecuadorians | 6.3 /100 | #212 | Tragic 82.3% |
| Immigrants | Uzbekistan | 5.8 /100 | #213 | Tragic 82.3% |
| Immigrants | Panama | 5.6 /100 | #214 | Tragic 82.2% |
| Iraqis | 5.6 /100 | #215 | Tragic 82.2% |
| Scottish | 5.3 /100 | #216 | Tragic 82.2% |
| Portuguese | 4.7 /100 | #217 | Tragic 82.2% |
| English | 4.4 /100 | #218 | Tragic 82.2% |
| French | 4.1 /100 | #219 | Tragic 82.2% |
| Bahamians | 3.6 /100 | #220 | Tragic 82.2% |
| Panamanians | 3.5 /100 | #221 | Tragic 82.2% |
| Immigrants | Ecuador | 3.4 /100 | #222 | Tragic 82.2% |
| Immigrants | Immigrants | 3.1 /100 | #223 | Tragic 82.1% |
| Immigrants | Jamaica | 2.7 /100 | #224 | Tragic 82.1% |
| Immigrants | Oceania | 2.5 /100 | #225 | Tragic 82.1% |
Demographics Similar to Czechs by In Labor Force | Age 45-54
In terms of in labor force | age 45-54, the demographic groups most similar to Czechs are Immigrants from Eastern Africa (83.9%, a difference of 0.010%), Immigrants from Sri Lanka (83.9%, a difference of 0.010%), Immigrants from Ireland (83.9%, a difference of 0.010%), Tlingit-Haida (83.9%, a difference of 0.020%), and Slovene (83.9%, a difference of 0.030%).
| Demographics | Rating | Rank | In Labor Force | Age 45-54 |
| Bulgarians | 100.0 /100 | #12 | Exceptional 84.2% |
| Chinese | 99.9 /100 | #13 | Exceptional 84.1% |
| Cambodians | 99.9 /100 | #14 | Exceptional 84.1% |
| Cypriots | 99.9 /100 | #15 | Exceptional 84.1% |
| Immigrants | Nepal | 99.9 /100 | #16 | Exceptional 84.0% |
| Zimbabweans | 99.9 /100 | #17 | Exceptional 84.0% |
| Immigrants | South Central Asia | 99.9 /100 | #18 | Exceptional 84.0% |
| Czechs | 99.8 /100 | #19 | Exceptional 83.9% |
| Immigrants | Eastern Africa | 99.8 /100 | #20 | Exceptional 83.9% |
| Immigrants | Sri Lanka | 99.8 /100 | #21 | Exceptional 83.9% |
| Immigrants | Ireland | 99.8 /100 | #22 | Exceptional 83.9% |
| Tlingit-Haida | 99.8 /100 | #23 | Exceptional 83.9% |
| Slovenes | 99.8 /100 | #24 | Exceptional 83.9% |
| Immigrants | North Macedonia | 99.8 /100 | #25 | Exceptional 83.9% |
| Immigrants | Serbia | 99.8 /100 | #26 | Exceptional 83.9% |