English vs Czech In Labor Force | Age 35-44
COMPARE
English
Czech
In Labor Force | Age 35-44
In Labor Force | Age 35-44 Comparison
English
Czechs
83.8%
IN LABOR FORCE | AGE 35-44
1.8/ 100
METRIC RATING
237th/ 347
METRIC RANK
85.3%
IN LABOR FORCE | AGE 35-44
99.9/ 100
METRIC RATING
31st/ 347
METRIC RANK
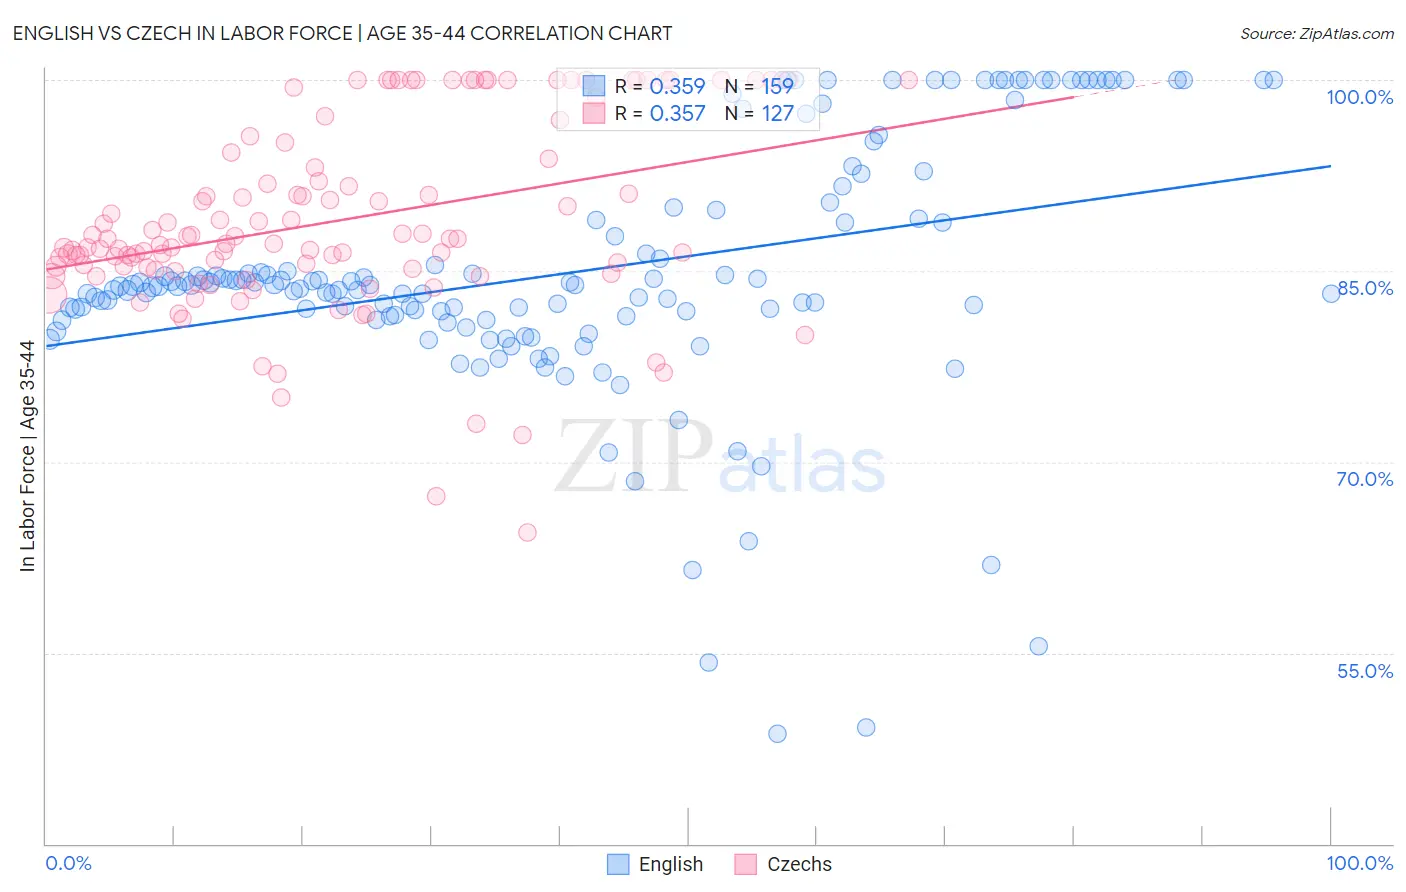
English vs Czech In Labor Force | Age 35-44 Correlation Chart
The statistical analysis conducted on geographies consisting of 578,949,713 people shows a mild positive correlation between the proportion of English and labor force participation rate among population between the ages 35 and 44 in the United States with a correlation coefficient (R) of 0.359 and weighted average of 83.8%. Similarly, the statistical analysis conducted on geographies consisting of 484,520,420 people shows a mild positive correlation between the proportion of Czechs and labor force participation rate among population between the ages 35 and 44 in the United States with a correlation coefficient (R) of 0.357 and weighted average of 85.3%, a difference of 1.8%.
In Labor Force | Age 35-44 Correlation Summary
| Measurement | English | Czech |
| Minimum | 48.7% | 64.5% |
| Maximum | 100.0% | 100.0% |
| Range | 51.3% | 35.5% |
| Mean | 84.9% | 89.0% |
| Median | 83.8% | 87.1% |
| Interquartile 25% (IQ1) | 81.5% | 85.2% |
| Interquartile 75% (IQ3) | 89.1% | 94.3% |
| Interquartile Range (IQR) | 7.7% | 9.1% |
| Standard Deviation (Sample) | 9.9% | 7.4% |
| Standard Deviation (Population) | 9.8% | 7.4% |
Similar Demographics by In Labor Force | Age 35-44
Demographics Similar to English by In Labor Force | Age 35-44
In terms of in labor force | age 35-44, the demographic groups most similar to English are Immigrants from Laos (83.8%, a difference of 0.020%), West Indian (83.9%, a difference of 0.040%), Immigrants from Syria (83.9%, a difference of 0.050%), Celtic (83.8%, a difference of 0.050%), and Arab (83.8%, a difference of 0.050%).
| Demographics | Rating | Rank | In Labor Force | Age 35-44 |
| Immigrants | Iraq | 3.7 /100 | #230 | Tragic 83.9% |
| Scottish | 3.2 /100 | #231 | Tragic 83.9% |
| Native Hawaiians | 3.0 /100 | #232 | Tragic 83.9% |
| Immigrants | Germany | 2.8 /100 | #233 | Tragic 83.9% |
| Immigrants | Oceania | 2.6 /100 | #234 | Tragic 83.9% |
| Immigrants | Syria | 2.5 /100 | #235 | Tragic 83.9% |
| West Indians | 2.4 /100 | #236 | Tragic 83.9% |
| English | 1.8 /100 | #237 | Tragic 83.8% |
| Immigrants | Laos | 1.7 /100 | #238 | Tragic 83.8% |
| Celtics | 1.4 /100 | #239 | Tragic 83.8% |
| Arabs | 1.3 /100 | #240 | Tragic 83.8% |
| Iraqis | 1.3 /100 | #241 | Tragic 83.8% |
| Immigrants | Cambodia | 1.1 /100 | #242 | Tragic 83.8% |
| Immigrants | Western Asia | 1.1 /100 | #243 | Tragic 83.8% |
| Guyanese | 1.1 /100 | #244 | Tragic 83.8% |
Demographics Similar to Czechs by In Labor Force | Age 35-44
In terms of in labor force | age 35-44, the demographic groups most similar to Czechs are Bermudan (85.3%, a difference of 0.0%), Immigrants from India (85.3%, a difference of 0.0%), Ugandan (85.3%, a difference of 0.010%), Cambodian (85.3%, a difference of 0.020%), and Immigrants from Nepal (85.3%, a difference of 0.030%).
| Demographics | Rating | Rank | In Labor Force | Age 35-44 |
| Latvians | 99.9 /100 | #24 | Exceptional 85.4% |
| Paraguayans | 99.9 /100 | #25 | Exceptional 85.4% |
| Immigrants | Liberia | 99.9 /100 | #26 | Exceptional 85.4% |
| Immigrants | Lithuania | 99.9 /100 | #27 | Exceptional 85.4% |
| Immigrants | Greece | 99.9 /100 | #28 | Exceptional 85.3% |
| Cambodians | 99.9 /100 | #29 | Exceptional 85.3% |
| Bermudans | 99.9 /100 | #30 | Exceptional 85.3% |
| Czechs | 99.9 /100 | #31 | Exceptional 85.3% |
| Immigrants | India | 99.9 /100 | #32 | Exceptional 85.3% |
| Ugandans | 99.9 /100 | #33 | Exceptional 85.3% |
| Immigrants | Nepal | 99.9 /100 | #34 | Exceptional 85.3% |
| Estonians | 99.9 /100 | #35 | Exceptional 85.3% |
| Immigrants | Morocco | 99.8 /100 | #36 | Exceptional 85.2% |
| Kenyans | 99.8 /100 | #37 | Exceptional 85.2% |
| Immigrants | Poland | 99.8 /100 | #38 | Exceptional 85.2% |