Ecuadorian vs Albanian Ambulatory Disability
COMPARE
Ecuadorian
Albanian
Ambulatory Disability
Ambulatory Disability Comparison
Ecuadorians
Albanians
6.1%
AMBULATORY DISABILITY
60.5/ 100
METRIC RATING
168th/ 347
METRIC RANK
6.2%
AMBULATORY DISABILITY
19.7/ 100
METRIC RATING
202nd/ 347
METRIC RANK
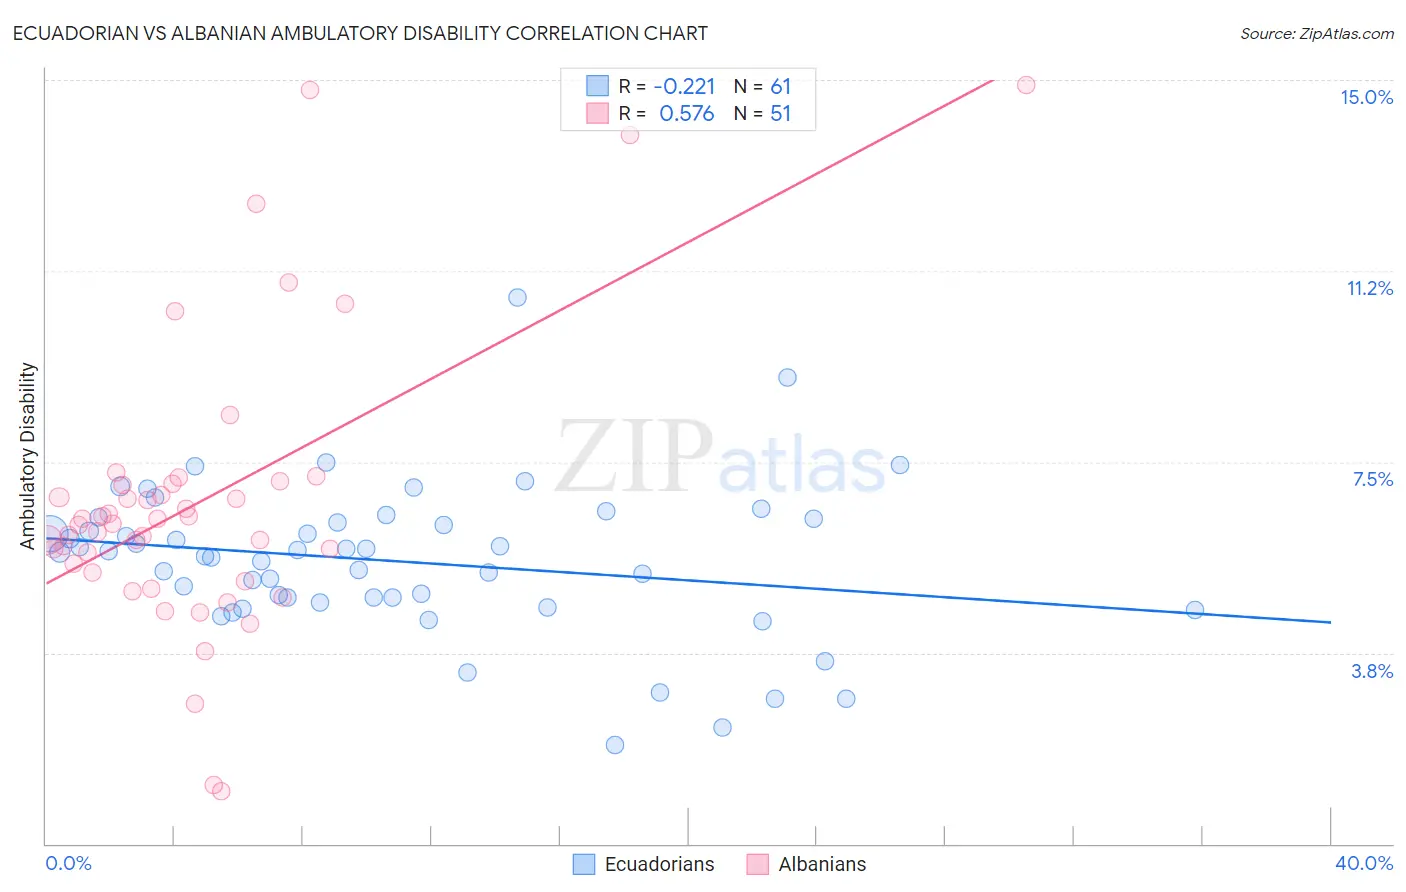
Ecuadorian vs Albanian Ambulatory Disability Correlation Chart
The statistical analysis conducted on geographies consisting of 317,738,990 people shows a weak negative correlation between the proportion of Ecuadorians and percentage of population with ambulatory disability in the United States with a correlation coefficient (R) of -0.221 and weighted average of 6.1%. Similarly, the statistical analysis conducted on geographies consisting of 193,248,883 people shows a substantial positive correlation between the proportion of Albanians and percentage of population with ambulatory disability in the United States with a correlation coefficient (R) of 0.576 and weighted average of 6.2%, a difference of 2.4%.
Ambulatory Disability Correlation Summary
| Measurement | Ecuadorian | Albanian |
| Minimum | 1.9% | 1.0% |
| Maximum | 10.7% | 14.9% |
| Range | 8.8% | 13.9% |
| Mean | 5.6% | 6.7% |
| Median | 5.7% | 6.3% |
| Interquartile 25% (IQ1) | 4.8% | 5.3% |
| Interquartile 75% (IQ3) | 6.3% | 7.1% |
| Interquartile Range (IQR) | 1.6% | 1.7% |
| Standard Deviation (Sample) | 1.5% | 2.8% |
| Standard Deviation (Population) | 1.5% | 2.8% |
Similar Demographics by Ambulatory Disability
Demographics Similar to Ecuadorians by Ambulatory Disability
In terms of ambulatory disability, the demographic groups most similar to Ecuadorians are Immigrants from Oceania (6.1%, a difference of 0.010%), Iraqi (6.1%, a difference of 0.13%), Immigrants from Southern Europe (6.1%, a difference of 0.14%), Nicaraguan (6.1%, a difference of 0.15%), and Basque (6.1%, a difference of 0.18%).
| Demographics | Rating | Rank | Ambulatory Disability |
| Immigrants | Belarus | 69.2 /100 | #161 | Good 6.1% |
| Nigerians | 67.1 /100 | #162 | Good 6.1% |
| Lebanese | 66.2 /100 | #163 | Good 6.1% |
| Basques | 63.7 /100 | #164 | Good 6.1% |
| Nicaraguans | 63.2 /100 | #165 | Good 6.1% |
| Iraqis | 62.8 /100 | #166 | Good 6.1% |
| Immigrants | Oceania | 60.7 /100 | #167 | Good 6.1% |
| Ecuadorians | 60.5 /100 | #168 | Good 6.1% |
| Immigrants | Southern Europe | 58.1 /100 | #169 | Average 6.1% |
| Immigrants | Ecuador | 53.8 /100 | #170 | Average 6.1% |
| Moroccans | 52.6 /100 | #171 | Average 6.1% |
| Immigrants | Burma/Myanmar | 52.2 /100 | #172 | Average 6.1% |
| Croatians | 51.2 /100 | #173 | Average 6.1% |
| Immigrants | Canada | 50.0 /100 | #174 | Average 6.1% |
| Vietnamese | 47.2 /100 | #175 | Average 6.1% |
Demographics Similar to Albanians by Ambulatory Disability
In terms of ambulatory disability, the demographic groups most similar to Albanians are Immigrants from Central America (6.2%, a difference of 0.030%), Immigrants from Ukraine (6.2%, a difference of 0.11%), Immigrants from Congo (6.2%, a difference of 0.13%), Immigrants from Cambodia (6.2%, a difference of 0.14%), and Slovene (6.2%, a difference of 0.15%).
| Demographics | Rating | Rank | Ambulatory Disability |
| Belgians | 28.6 /100 | #195 | Fair 6.2% |
| Malaysians | 28.2 /100 | #196 | Fair 6.2% |
| Poles | 26.3 /100 | #197 | Fair 6.2% |
| Immigrants | Bangladesh | 24.6 /100 | #198 | Fair 6.2% |
| Italians | 22.6 /100 | #199 | Fair 6.2% |
| Immigrants | Cambodia | 21.5 /100 | #200 | Fair 6.2% |
| Immigrants | Central America | 20.1 /100 | #201 | Fair 6.2% |
| Albanians | 19.7 /100 | #202 | Poor 6.2% |
| Immigrants | Ukraine | 18.4 /100 | #203 | Poor 6.2% |
| Immigrants | Congo | 18.2 /100 | #204 | Poor 6.2% |
| Slovenes | 18.0 /100 | #205 | Poor 6.2% |
| Finns | 17.2 /100 | #206 | Poor 6.2% |
| Alsatians | 15.1 /100 | #207 | Poor 6.3% |
| Bangladeshis | 14.2 /100 | #208 | Poor 6.3% |
| Immigrants | Iraq | 14.0 /100 | #209 | Poor 6.3% |