Cape Verdean vs Immigrants from Turkey Vision Disability
COMPARE
Cape Verdean
Immigrants from Turkey
Vision Disability
Vision Disability Comparison
Cape Verdeans
Immigrants from Turkey
2.4%
VISION DISABILITY
0.0/ 100
METRIC RATING
280th/ 347
METRIC RANK
1.9%
VISION DISABILITY
99.8/ 100
METRIC RATING
34th/ 347
METRIC RANK
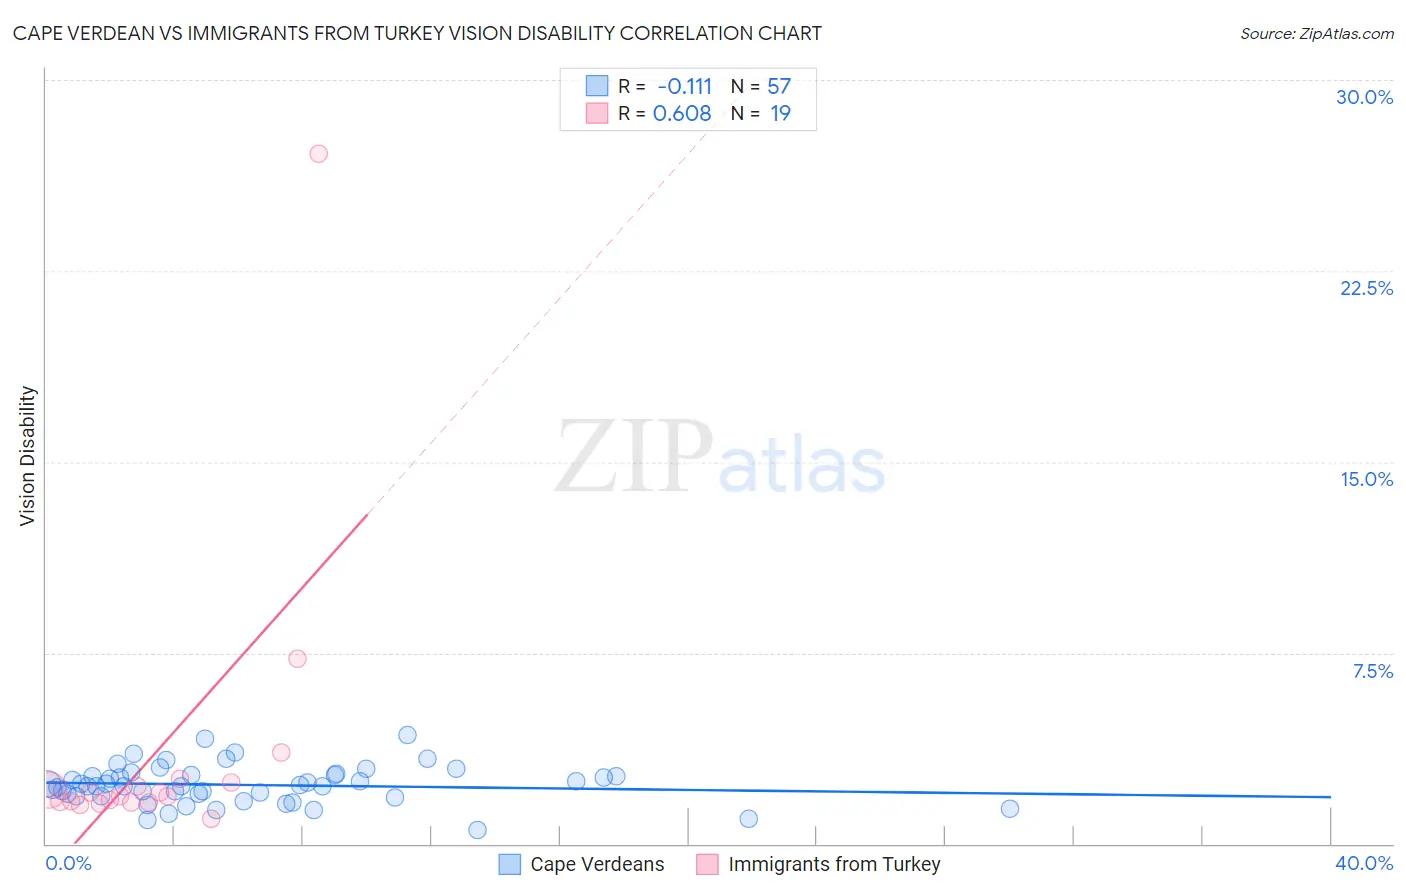
Cape Verdean vs Immigrants from Turkey Vision Disability Correlation Chart
The statistical analysis conducted on geographies consisting of 107,539,896 people shows a poor negative correlation between the proportion of Cape Verdeans and percentage of population with vision disability in the United States with a correlation coefficient (R) of -0.111 and weighted average of 2.4%. Similarly, the statistical analysis conducted on geographies consisting of 222,977,745 people shows a significant positive correlation between the proportion of Immigrants from Turkey and percentage of population with vision disability in the United States with a correlation coefficient (R) of 0.608 and weighted average of 1.9%, a difference of 25.6%.
Vision Disability Correlation Summary
| Measurement | Cape Verdean | Immigrants from Turkey |
| Minimum | 0.56% | 0.99% |
| Maximum | 4.3% | 27.1% |
| Range | 3.7% | 26.1% |
| Mean | 2.3% | 3.6% |
| Median | 2.3% | 1.8% |
| Interquartile 25% (IQ1) | 1.9% | 1.6% |
| Interquartile 75% (IQ3) | 2.7% | 2.4% |
| Interquartile Range (IQR) | 0.84% | 0.80% |
| Standard Deviation (Sample) | 0.75% | 5.9% |
| Standard Deviation (Population) | 0.74% | 5.7% |
Similar Demographics by Vision Disability
Demographics Similar to Cape Verdeans by Vision Disability
In terms of vision disability, the demographic groups most similar to Cape Verdeans are Nepalese (2.4%, a difference of 0.040%), Spanish (2.4%, a difference of 0.050%), Bahamian (2.4%, a difference of 0.21%), U.S. Virgin Islander (2.5%, a difference of 0.23%), and Scotch-Irish (2.4%, a difference of 0.25%).
| Demographics | Rating | Rank | Vision Disability |
| Immigrants | Bahamas | 0.1 /100 | #273 | Tragic 2.4% |
| Immigrants | Latin America | 0.0 /100 | #274 | Tragic 2.4% |
| Chippewa | 0.0 /100 | #275 | Tragic 2.4% |
| Scotch-Irish | 0.0 /100 | #276 | Tragic 2.4% |
| Bahamians | 0.0 /100 | #277 | Tragic 2.4% |
| Spanish | 0.0 /100 | #278 | Tragic 2.4% |
| Nepalese | 0.0 /100 | #279 | Tragic 2.4% |
| Cape Verdeans | 0.0 /100 | #280 | Tragic 2.4% |
| U.S. Virgin Islanders | 0.0 /100 | #281 | Tragic 2.5% |
| Immigrants | Caribbean | 0.0 /100 | #282 | Tragic 2.5% |
| Puget Sound Salish | 0.0 /100 | #283 | Tragic 2.5% |
| Yakama | 0.0 /100 | #284 | Tragic 2.5% |
| Immigrants | Central America | 0.0 /100 | #285 | Tragic 2.5% |
| Sioux | 0.0 /100 | #286 | Tragic 2.5% |
| Hondurans | 0.0 /100 | #287 | Tragic 2.5% |
Demographics Similar to Immigrants from Turkey by Vision Disability
In terms of vision disability, the demographic groups most similar to Immigrants from Turkey are Immigrants from Australia (1.9%, a difference of 0.10%), Immigrants from Egypt (1.9%, a difference of 0.13%), Luxembourger (1.9%, a difference of 0.43%), Cambodian (2.0%, a difference of 0.44%), and Bhutanese (2.0%, a difference of 0.69%).
| Demographics | Rating | Rank | Vision Disability |
| Taiwanese | 99.9 /100 | #27 | Exceptional 1.9% |
| Immigrants | Malaysia | 99.9 /100 | #28 | Exceptional 1.9% |
| Egyptians | 99.9 /100 | #29 | Exceptional 1.9% |
| Immigrants | Nepal | 99.9 /100 | #30 | Exceptional 1.9% |
| Mongolians | 99.9 /100 | #31 | Exceptional 1.9% |
| Luxembourgers | 99.9 /100 | #32 | Exceptional 1.9% |
| Immigrants | Egypt | 99.9 /100 | #33 | Exceptional 1.9% |
| Immigrants | Turkey | 99.8 /100 | #34 | Exceptional 1.9% |
| Immigrants | Australia | 99.8 /100 | #35 | Exceptional 1.9% |
| Cambodians | 99.8 /100 | #36 | Exceptional 2.0% |
| Bhutanese | 99.8 /100 | #37 | Exceptional 2.0% |
| Immigrants | Kuwait | 99.8 /100 | #38 | Exceptional 2.0% |
| Zimbabweans | 99.7 /100 | #39 | Exceptional 2.0% |
| Immigrants | Ireland | 99.7 /100 | #40 | Exceptional 2.0% |
| Cypriots | 99.7 /100 | #41 | Exceptional 2.0% |