Immigrants from Latin America vs Immigrants from Turkey Vision Disability
COMPARE
Immigrants from Latin America
Immigrants from Turkey
Vision Disability
Vision Disability Comparison
Immigrants from Latin America
Immigrants from Turkey
2.4%
VISION DISABILITY
0.0/ 100
METRIC RATING
274th/ 347
METRIC RANK
1.9%
VISION DISABILITY
99.8/ 100
METRIC RATING
34th/ 347
METRIC RANK
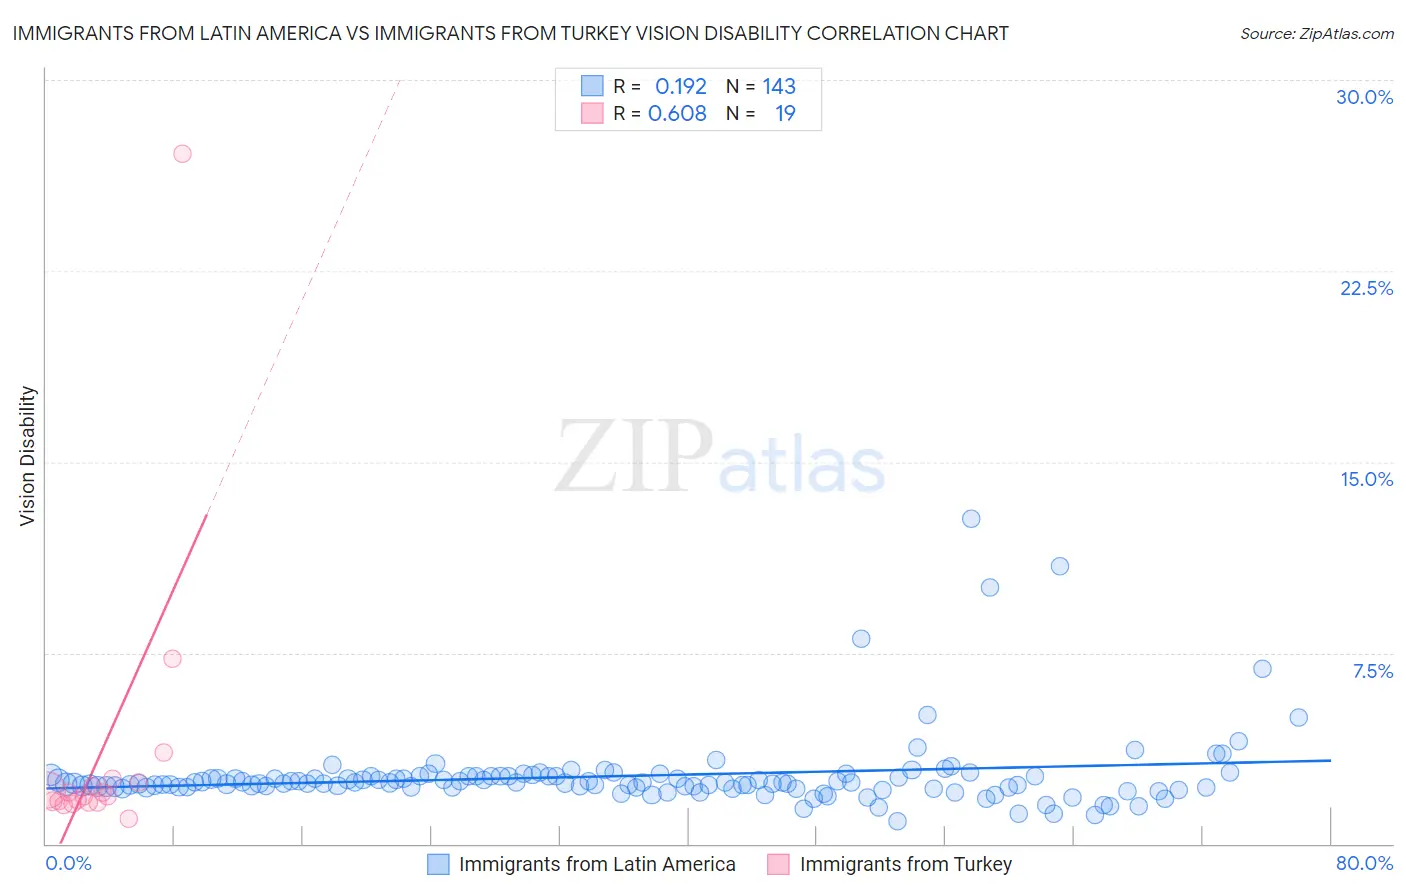
Immigrants from Latin America vs Immigrants from Turkey Vision Disability Correlation Chart
The statistical analysis conducted on geographies consisting of 557,074,297 people shows a poor positive correlation between the proportion of Immigrants from Latin America and percentage of population with vision disability in the United States with a correlation coefficient (R) of 0.192 and weighted average of 2.4%. Similarly, the statistical analysis conducted on geographies consisting of 222,977,745 people shows a significant positive correlation between the proportion of Immigrants from Turkey and percentage of population with vision disability in the United States with a correlation coefficient (R) of 0.608 and weighted average of 1.9%, a difference of 24.8%.
Vision Disability Correlation Summary
| Measurement | Immigrants from Latin America | Immigrants from Turkey |
| Minimum | 0.90% | 0.99% |
| Maximum | 12.7% | 27.1% |
| Range | 11.8% | 26.1% |
| Mean | 2.7% | 3.6% |
| Median | 2.4% | 1.8% |
| Interquartile 25% (IQ1) | 2.2% | 1.6% |
| Interquartile 75% (IQ3) | 2.7% | 2.4% |
| Interquartile Range (IQR) | 0.43% | 0.80% |
| Standard Deviation (Sample) | 1.5% | 5.9% |
| Standard Deviation (Population) | 1.5% | 5.7% |
Similar Demographics by Vision Disability
Demographics Similar to Immigrants from Latin America by Vision Disability
In terms of vision disability, the demographic groups most similar to Immigrants from Latin America are Immigrants from Bahamas (2.4%, a difference of 0.31%), Chippewa (2.4%, a difference of 0.32%), Scotch-Irish (2.4%, a difference of 0.41%), Bahamian (2.4%, a difference of 0.45%), and Spanish (2.4%, a difference of 0.61%).
| Demographics | Rating | Rank | Vision Disability |
| Ute | 0.1 /100 | #267 | Tragic 2.4% |
| Senegalese | 0.1 /100 | #268 | Tragic 2.4% |
| Celtics | 0.1 /100 | #269 | Tragic 2.4% |
| Cubans | 0.1 /100 | #270 | Tragic 2.4% |
| Immigrants | Azores | 0.1 /100 | #271 | Tragic 2.4% |
| Spaniards | 0.1 /100 | #272 | Tragic 2.4% |
| Immigrants | Bahamas | 0.1 /100 | #273 | Tragic 2.4% |
| Immigrants | Latin America | 0.0 /100 | #274 | Tragic 2.4% |
| Chippewa | 0.0 /100 | #275 | Tragic 2.4% |
| Scotch-Irish | 0.0 /100 | #276 | Tragic 2.4% |
| Bahamians | 0.0 /100 | #277 | Tragic 2.4% |
| Spanish | 0.0 /100 | #278 | Tragic 2.4% |
| Nepalese | 0.0 /100 | #279 | Tragic 2.4% |
| Cape Verdeans | 0.0 /100 | #280 | Tragic 2.4% |
| U.S. Virgin Islanders | 0.0 /100 | #281 | Tragic 2.5% |
Demographics Similar to Immigrants from Turkey by Vision Disability
In terms of vision disability, the demographic groups most similar to Immigrants from Turkey are Immigrants from Australia (1.9%, a difference of 0.10%), Immigrants from Egypt (1.9%, a difference of 0.13%), Luxembourger (1.9%, a difference of 0.43%), Cambodian (2.0%, a difference of 0.44%), and Bhutanese (2.0%, a difference of 0.69%).
| Demographics | Rating | Rank | Vision Disability |
| Taiwanese | 99.9 /100 | #27 | Exceptional 1.9% |
| Immigrants | Malaysia | 99.9 /100 | #28 | Exceptional 1.9% |
| Egyptians | 99.9 /100 | #29 | Exceptional 1.9% |
| Immigrants | Nepal | 99.9 /100 | #30 | Exceptional 1.9% |
| Mongolians | 99.9 /100 | #31 | Exceptional 1.9% |
| Luxembourgers | 99.9 /100 | #32 | Exceptional 1.9% |
| Immigrants | Egypt | 99.9 /100 | #33 | Exceptional 1.9% |
| Immigrants | Turkey | 99.8 /100 | #34 | Exceptional 1.9% |
| Immigrants | Australia | 99.8 /100 | #35 | Exceptional 1.9% |
| Cambodians | 99.8 /100 | #36 | Exceptional 2.0% |
| Bhutanese | 99.8 /100 | #37 | Exceptional 2.0% |
| Immigrants | Kuwait | 99.8 /100 | #38 | Exceptional 2.0% |
| Zimbabweans | 99.7 /100 | #39 | Exceptional 2.0% |
| Immigrants | Ireland | 99.7 /100 | #40 | Exceptional 2.0% |
| Cypriots | 99.7 /100 | #41 | Exceptional 2.0% |