Australian vs Immigrants from Turkey Vision Disability

COMPARE

Australian
Race
Ancestry
AfghanAfricanAlaska NativeAlaskan AthabascanAlbanianAleutAlsatianAmericanApacheArabArapahoArgentineanArmenianAssyrian/Chaldean/SyriacAustralianAustrianBahamianBangladeshiBarbadianBasqueBelgianBelizeanBermudanBhutaneseBlackfeetBolivianBrazilianBritishBritish West IndianBulgarianBurmeseCajunCambodianCanadianCape VerdeanCarpatho RusynCelticCentral AmericanCentral American IndianCherokeeCheyenneChickasawChileanChineseChippewaChoctawColombianColvilleComancheCosta RicanCreeCreekCroatianCrowCubanCypriotCzechCzechoslovakianDanishDelawareDominicanDutchDutch West IndianEastern EuropeanEcuadorianEgyptianEnglishEstonianEthiopianEuropeanFijianFilipinoFinnishFrenchFrench American IndianFrench CanadianGermanGerman RussianGhanaianGreekGuamanian/ChamorroGuatemalanGuyaneseHaitianHmongHonduranHopiHoumaHungarianIcelanderIndian (Asian)IndonesianInupiatIranianIraqiIrishIroquoisIsraeliItalianJamaicanJapaneseJordanianKenyanKiowaKoreanLaotianLatvianLebaneseLiberianLithuanianLumbeeLuxembourgerMacedonianMalaysianMalteseMarshalleseMenomineeMexicanMexican American IndianMongolianMoroccanNative HawaiianNavajoNepaleseNew ZealanderNicaraguanNigerianNorthern EuropeanNorwegianOkinawanOsageOttawaPaiutePakistaniPalestinianPanamanianParaguayanPennsylvania GermanPeruvianPimaPolishPortuguesePotawatomiPuebloPuerto RicanPuget Sound SalishRomanianRussianSalvadoranSamoanScandinavianScotch-IrishScottishSeminoleSenegaleseSerbianShoshoneSierra LeoneanSiouxSlavicSlovakSloveneSomaliSouth AfricanSouth AmericanSouth American IndianSoviet UnionSpaniardSpanishSpanish AmericanSpanish American IndianSri LankanSubsaharan AfricanSudaneseSwedishSwissSyrianTaiwaneseThaiTlingit-HaidaTohono O'OdhamTonganTrinidadian and TobagonianTsimshianTurkishU.S. Virgin IslanderUgandanUkrainianUruguayanUteVenezuelanVietnameseWelshWest IndianYakamaYaquiYugoslavianYumanYup'ikZimbabwean
Immigration
NonimmigrantsImmigrantsAfghanistanAfricaAlbaniaArgentinaArmeniaAsiaAustraliaAustriaBahamasBangladeshBarbadosBelarusBelgiumBelizeBoliviaBosnia and HerzegovinaBrazilBulgariaBurma/MyanmarCabo VerdeCambodiaCameroonCanadaCaribbeanCentral AmericaChileChinaColombiaCongoCosta RicaCroatiaCubaCzechoslovakiaDenmarkDominicaDominican RepublicEastern AfricaEastern AsiaEastern EuropeEcuadorEgyptEl SalvadorEnglandEritreaEthiopiaEuropeFijiFranceGermanyGhanaGreeceGrenadaGuatemalaGuyanaHaitiHondurasHong KongHungaryIndiaIndonesiaIranIraqIrelandIsraelItalyJamaicaJapanJordanKazakhstanKenyaKoreaKuwaitLaosLatin AmericaLatviaLebanonLiberiaLithuaniaMalaysiaMexicoMicronesiaMiddle AfricaMoldovaMoroccoNepalNetherlandsNicaraguaNigeriaNorth AmericaNorth MacedoniaNorthern AfricaNorthern EuropeNorwayOceaniaPakistanPanamaPeruPhilippinesPolandPortugalRomaniaRussiaSaudi ArabiaScotlandSenegalSerbiaSierra LeoneSingaporeSomaliaSouth AfricaSouth AmericaSouth Central AsiaSouth Eastern AsiaSouthern EuropeSpainSri LankaSt. Vincent and the GrenadinesSudanSwedenSwitzerlandSyriaTaiwanThailandTrinidad and TobagoUgandaUkraineUruguayUzbekistanVenezuelaVietnamWest IndiesWestern AfricaWestern AsiaWestern EuropeYemenZaireZimbabweAzores
Immigrants from Turkey
Race
Ancestry
AfghanAfricanAlaska NativeAlaskan AthabascanAlbanianAleutAlsatianAmericanApacheArabArapahoArgentineanArmenianAssyrian/Chaldean/SyriacAustrianBahamianBangladeshiBarbadianBasqueBelgianBelizeanBermudanBhutaneseBlackfeetBolivianBrazilianBritishBritish West IndianBulgarianBurmeseCajunCambodianCanadianCape VerdeanCarpatho RusynCelticCentral AmericanCentral American IndianCherokeeCheyenneChickasawChileanChineseChippewaChoctawColombianColvilleComancheCosta RicanCreeCreekCroatianCrowCubanCypriotCzechCzechoslovakianDanishDelawareDominicanDutchDutch West IndianEastern EuropeanEcuadorianEgyptianEnglishEstonianEthiopianEuropeanFijianFilipinoFinnishFrenchFrench American IndianFrench CanadianGermanGerman RussianGhanaianGreekGuamanian/ChamorroGuatemalanGuyaneseHaitianHmongHonduranHopiHoumaHungarianIcelanderIndian (Asian)IndonesianInupiatIranianIraqiIrishIroquoisIsraeliItalianJamaicanJapaneseJordanianKenyanKiowaKoreanLaotianLatvianLebaneseLiberianLithuanianLumbeeLuxembourgerMacedonianMalaysianMalteseMarshalleseMenomineeMexicanMexican American IndianMongolianMoroccanNative HawaiianNavajoNepaleseNew ZealanderNicaraguanNigerianNorthern EuropeanNorwegianOkinawanOsageOttawaPaiutePakistaniPalestinianPanamanianParaguayanPennsylvania GermanPeruvianPimaPolishPortuguesePotawatomiPuebloPuerto RicanPuget Sound SalishRomanianRussianSalvadoranSamoanScandinavianScotch-IrishScottishSeminoleSenegaleseSerbianShoshoneSierra LeoneanSiouxSlavicSlovakSloveneSomaliSouth AfricanSouth AmericanSouth American IndianSoviet UnionSpaniardSpanishSpanish AmericanSpanish American IndianSri LankanSubsaharan AfricanSudaneseSwedishSwissSyrianTaiwaneseThaiTlingit-HaidaTohono O'OdhamTonganTrinidadian and TobagonianTsimshianTurkishU.S. Virgin IslanderUgandanUkrainianUruguayanUteVenezuelanVietnameseWelshWest IndianYakamaYaquiYugoslavianYumanYup'ikZimbabwean
Immigration
NonimmigrantsImmigrantsAfghanistanAfricaAlbaniaArgentinaArmeniaAsiaAustraliaAustriaBahamasBangladeshBarbadosBelarusBelgiumBelizeBoliviaBosnia and HerzegovinaBrazilBulgariaBurma/MyanmarCabo VerdeCambodiaCameroonCanadaCaribbeanCentral AmericaChileChinaColombiaCongoCosta RicaCroatiaCubaCzechoslovakiaDenmarkDominicaDominican RepublicEastern AfricaEastern AsiaEastern EuropeEcuadorEgyptEl SalvadorEnglandEritreaEthiopiaEuropeFijiFranceGermanyGhanaGreeceGrenadaGuatemalaGuyanaHaitiHondurasHong KongHungaryIndiaIndonesiaIranIraqIrelandIsraelItalyJamaicaJapanJordanKazakhstanKenyaKoreaKuwaitLaosLatin AmericaLatviaLebanonLiberiaLithuaniaMalaysiaMexicoMicronesiaMiddle AfricaMoldovaMoroccoNepalNetherlandsNicaraguaNigeriaNorth AmericaNorth MacedoniaNorthern AfricaNorthern EuropeNorwayOceaniaPakistanPanamaPeruPhilippinesPolandPortugalRomaniaRussiaSaudi ArabiaScotlandSenegalSerbiaSierra LeoneSingaporeSomaliaSouth AfricaSouth AmericaSouth Central AsiaSouth Eastern AsiaSouthern EuropeSpainSri LankaSt. Vincent and the GrenadinesSudanSwedenSwitzerlandSyriaTaiwanThailandTrinidad and TobagoTurkeyUgandaUkraineUruguayUzbekistanVenezuelaVietnamWest IndiesWestern AfricaWestern AsiaWestern EuropeYemenZaireZimbabweAzores
Vision Disability
Income
Poverty
Unemployment
Labor Participation
Family Structure
Vehicle Availability
Education Level
Disability

Vision Disability Comparison

Australians

Immigrants from Turkey

Exceptional
Exceptional
2.1%
VISION DISABILITY
95.9/ 100
METRIC RATING
95th/ 347
METRIC RANK
1.9%
VISION DISABILITY
99.8/ 100
METRIC RATING
34th/ 347
METRIC RANK

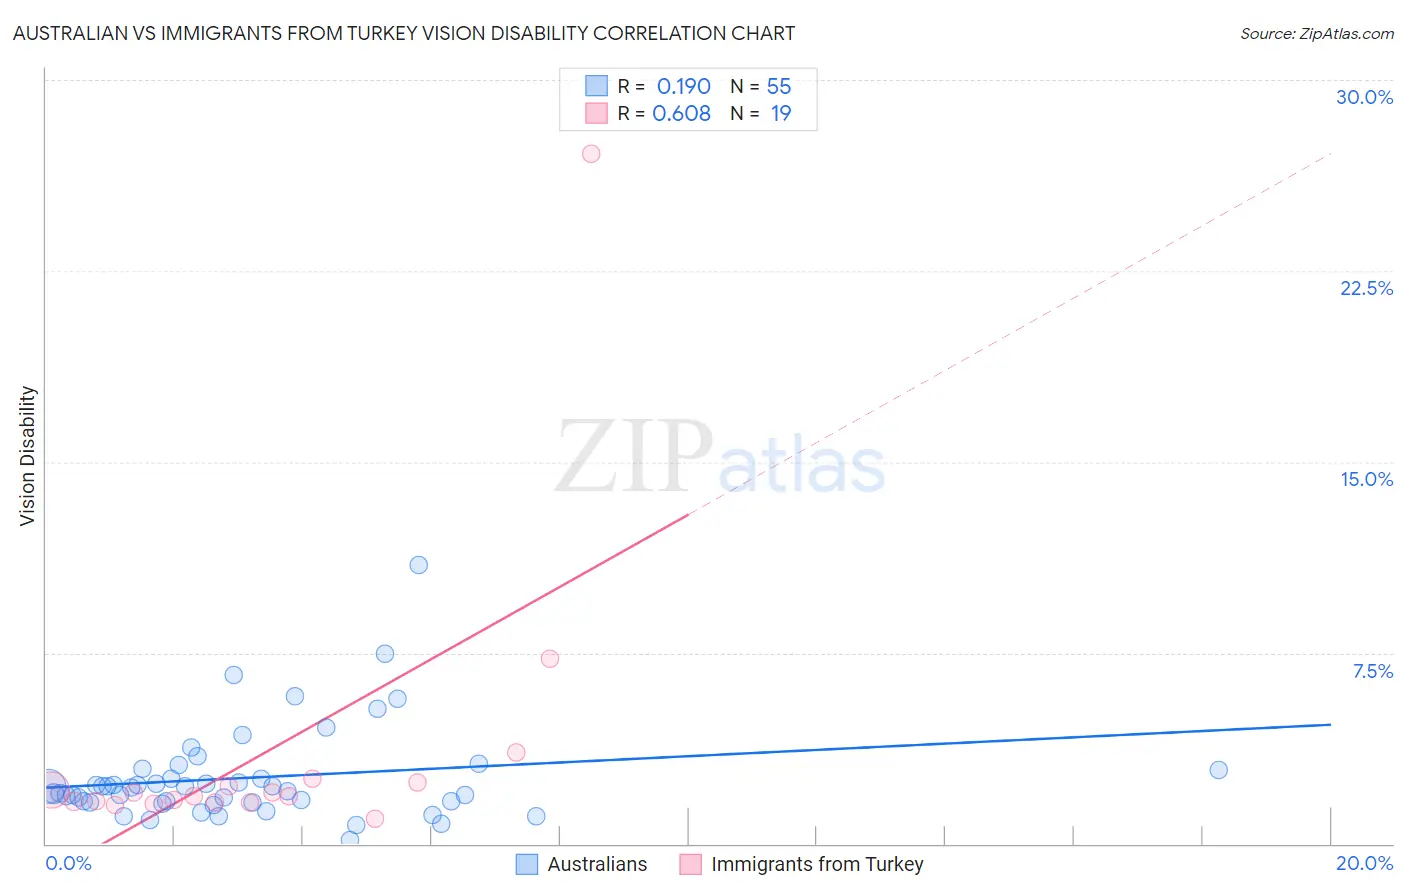
Australian vs Immigrants from Turkey Vision Disability Correlation Chart

The statistical analysis conducted on geographies consisting of 224,056,870 people shows a poor positive correlation between the proportion of Australians and percentage of population with vision disability in the United States with a correlation coefficient (R) of 0.190 and weighted average of 2.1%. Similarly, the statistical analysis conducted on geographies consisting of 222,977,745 people shows a significant positive correlation between the proportion of Immigrants from Turkey and percentage of population with vision disability in the United States with a correlation coefficient (R) of 0.608 and weighted average of 1.9%, a difference of 5.8%.
Australian vs Immigrants from Turkey Vision Disability

Vision Disability Correlation Summary

MeasurementAustralianImmigrants from Turkey
Minimum0.16%0.99%
Maximum11.0%27.1%
Range10.8%26.1%
Mean2.6%3.6%
Median2.2%1.8%
Interquartile 25% (IQ1)1.6%1.6%
Interquartile 75% (IQ3)2.9%2.4%
Interquartile Range (IQR)1.3%0.80%
Standard Deviation (Sample)1.9%5.9%
Standard Deviation (Population)1.8%5.7%

Similar Demographics by Vision Disability

Demographics Similar to Australians by Vision Disability

In terms of vision disability, the demographic groups most similar to Australians are Romanian (2.1%, a difference of 0.060%), Immigrants from Croatia (2.1%, a difference of 0.070%), Immigrants from Europe (2.1%, a difference of 0.090%), Immigrants from Afghanistan (2.1%, a difference of 0.13%), and Immigrants from Syria (2.1%, a difference of 0.14%).
DemographicsRating | RankVision Disability
Norwegians
97.0
/100
|
#88
Exceptional
2.0%
Immigrants | Eastern Africa
97.0
/100
|
#89
Exceptional
2.0%
Immigrants | Lebanon
96.7
/100
|
#90
Exceptional
2.1%
Immigrants | Somalia
96.2
/100
|
#91
Exceptional
2.1%
Immigrants | Syria
96.2
/100
|
#92
Exceptional
2.1%
Immigrants | Europe
96.1
/100
|
#93
Exceptional
2.1%
Immigrants | Croatia
96.0
/100
|
#94
Exceptional
2.1%
Australians
95.9
/100
|
#95
Exceptional
2.1%
Romanians
95.7
/100
|
#96
Exceptional
2.1%
Immigrants | Afghanistan
95.6
/100
|
#97
Exceptional
2.1%
Immigrants | South Africa
95.4
/100
|
#98
Exceptional
2.1%
Estonians
95.3
/100
|
#99
Exceptional
2.1%
Greeks
95.1
/100
|
#100
Exceptional
2.1%
Albanians
94.9
/100
|
#101
Exceptional
2.1%
Sri Lankans
94.8
/100
|
#102
Exceptional
2.1%

Demographics Similar to Immigrants from Turkey by Vision Disability

In terms of vision disability, the demographic groups most similar to Immigrants from Turkey are Immigrants from Australia (1.9%, a difference of 0.10%), Immigrants from Egypt (1.9%, a difference of 0.13%), Luxembourger (1.9%, a difference of 0.43%), Cambodian (2.0%, a difference of 0.44%), and Bhutanese (2.0%, a difference of 0.69%).
DemographicsRating | RankVision Disability
Taiwanese
99.9
/100
|
#27
Exceptional
1.9%
Immigrants | Malaysia
99.9
/100
|
#28
Exceptional
1.9%
Egyptians
99.9
/100
|
#29
Exceptional
1.9%
Immigrants | Nepal
99.9
/100
|
#30
Exceptional
1.9%
Mongolians
99.9
/100
|
#31
Exceptional
1.9%
Luxembourgers
99.9
/100
|
#32
Exceptional
1.9%
Immigrants | Egypt
99.9
/100
|
#33
Exceptional
1.9%
Immigrants | Turkey
99.8
/100
|
#34
Exceptional
1.9%
Immigrants | Australia
99.8
/100
|
#35
Exceptional
1.9%
Cambodians
99.8
/100
|
#36
Exceptional
2.0%
Bhutanese
99.8
/100
|
#37
Exceptional
2.0%
Immigrants | Kuwait
99.8
/100
|
#38
Exceptional
2.0%
Zimbabweans
99.7
/100
|
#39
Exceptional
2.0%
Immigrants | Ireland
99.7
/100
|
#40
Exceptional
2.0%
Cypriots
99.7
/100
|
#41
Exceptional
2.0%