Dominican vs Immigrants from Italy 11th Grade
COMPARE
Dominican
Immigrants from Italy
11th Grade
11th Grade Comparison
Dominicans
Immigrants from Italy
87.7%
11TH GRADE
0.0/ 100
METRIC RATING
326th/ 347
METRIC RANK
92.9%
11TH GRADE
86.6/ 100
METRIC RATING
135th/ 347
METRIC RANK
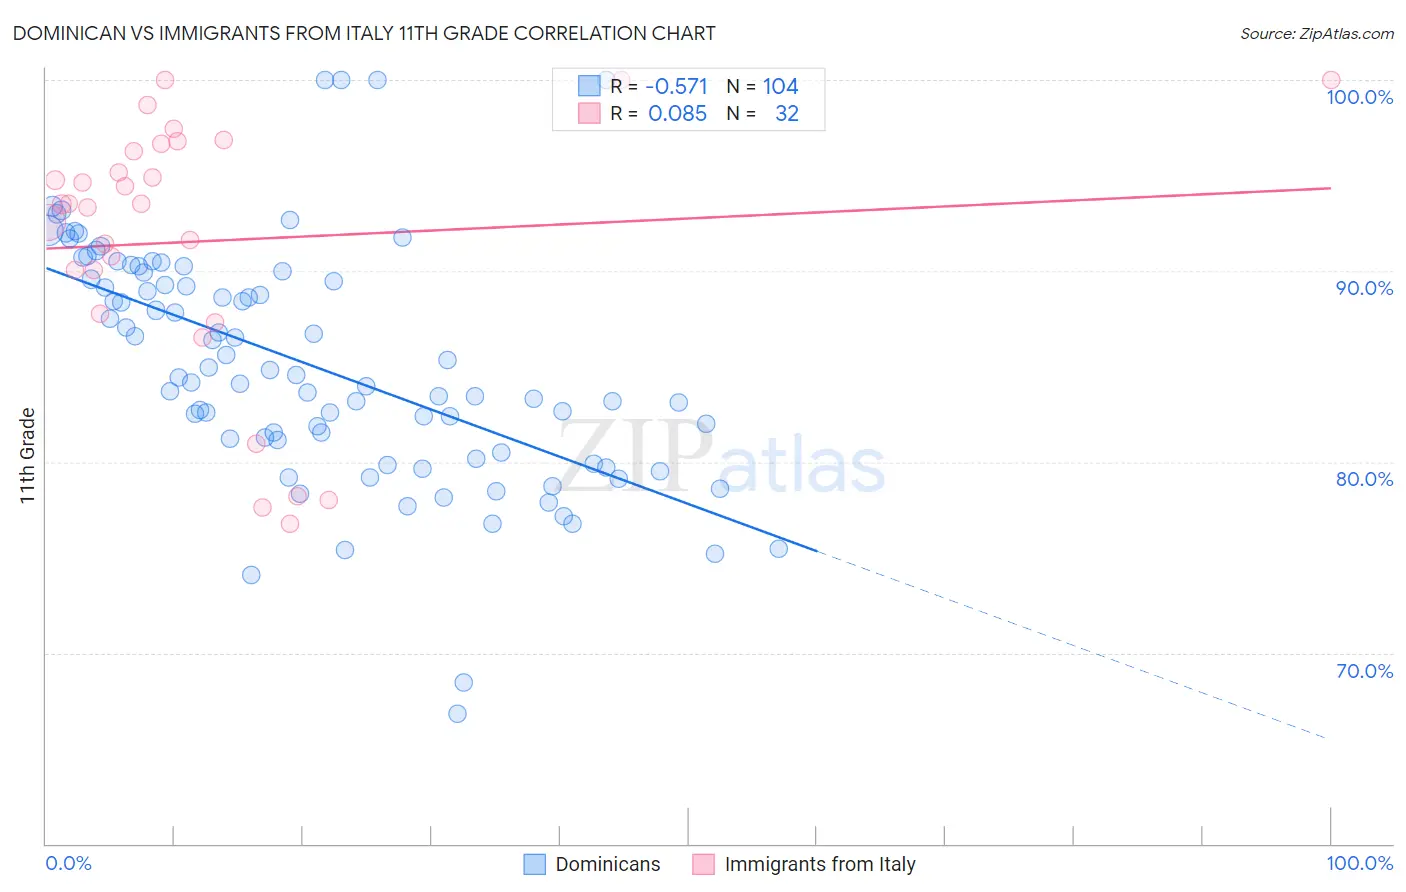
Dominican vs Immigrants from Italy 11th Grade Correlation Chart
The statistical analysis conducted on geographies consisting of 355,142,452 people shows a substantial negative correlation between the proportion of Dominicans and percentage of population with at least 11th grade education in the United States with a correlation coefficient (R) of -0.571 and weighted average of 87.7%. Similarly, the statistical analysis conducted on geographies consisting of 324,226,009 people shows a slight positive correlation between the proportion of Immigrants from Italy and percentage of population with at least 11th grade education in the United States with a correlation coefficient (R) of 0.085 and weighted average of 92.9%, a difference of 6.0%.
11th Grade Correlation Summary
| Measurement | Dominican | Immigrants from Italy |
| Minimum | 66.8% | 76.7% |
| Maximum | 100.0% | 100.0% |
| Range | 33.2% | 23.3% |
| Mean | 85.1% | 91.6% |
| Median | 84.5% | 93.5% |
| Interquartile 25% (IQ1) | 80.8% | 88.9% |
| Interquartile 75% (IQ3) | 89.7% | 96.5% |
| Interquartile Range (IQR) | 8.9% | 7.6% |
| Standard Deviation (Sample) | 6.2% | 6.8% |
| Standard Deviation (Population) | 6.2% | 6.7% |
Similar Demographics by 11th Grade
Demographics Similar to Dominicans by 11th Grade
In terms of 11th grade, the demographic groups most similar to Dominicans are Immigrants from Cabo Verde (87.6%, a difference of 0.020%), Tohono O'odham (87.6%, a difference of 0.080%), Mexican American Indian (87.5%, a difference of 0.15%), Honduran (87.4%, a difference of 0.34%), and Hispanic or Latino (87.3%, a difference of 0.40%).
| Demographics | Rating | Rank | 11th Grade |
| Belizeans | 0.0 /100 | #319 | Tragic 88.8% |
| Immigrants | Armenia | 0.0 /100 | #320 | Tragic 88.8% |
| Immigrants | Belize | 0.0 /100 | #321 | Tragic 88.7% |
| Puerto Ricans | 0.0 /100 | #322 | Tragic 88.4% |
| Pima | 0.0 /100 | #323 | Tragic 88.3% |
| Central American Indians | 0.0 /100 | #324 | Tragic 88.2% |
| Immigrants | Nicaragua | 0.0 /100 | #325 | Tragic 88.1% |
| Dominicans | 0.0 /100 | #326 | Tragic 87.7% |
| Immigrants | Cabo Verde | 0.0 /100 | #327 | Tragic 87.6% |
| Tohono O'odham | 0.0 /100 | #328 | Tragic 87.6% |
| Mexican American Indians | 0.0 /100 | #329 | Tragic 87.5% |
| Hondurans | 0.0 /100 | #330 | Tragic 87.4% |
| Hispanics or Latinos | 0.0 /100 | #331 | Tragic 87.3% |
| Immigrants | Azores | 0.0 /100 | #332 | Tragic 87.2% |
| Immigrants | Yemen | 0.0 /100 | #333 | Tragic 87.1% |
Demographics Similar to Immigrants from Italy by 11th Grade
In terms of 11th grade, the demographic groups most similar to Immigrants from Italy are Cree (92.9%, a difference of 0.010%), Mongolian (93.0%, a difference of 0.020%), Delaware (93.0%, a difference of 0.020%), Arab (92.9%, a difference of 0.020%), and Immigrants from Brazil (92.9%, a difference of 0.030%).
| Demographics | Rating | Rank | 11th Grade |
| Immigrants | Jordan | 92.4 /100 | #128 | Exceptional 93.1% |
| Immigrants | Ukraine | 89.8 /100 | #129 | Excellent 93.0% |
| Albanians | 89.5 /100 | #130 | Excellent 93.0% |
| Egyptians | 89.5 /100 | #131 | Excellent 93.0% |
| Immigrants | Bosnia and Herzegovina | 89.0 /100 | #132 | Excellent 93.0% |
| Mongolians | 87.6 /100 | #133 | Excellent 93.0% |
| Delaware | 87.3 /100 | #134 | Excellent 93.0% |
| Immigrants | Italy | 86.6 /100 | #135 | Excellent 92.9% |
| Cree | 85.9 /100 | #136 | Excellent 92.9% |
| Arabs | 85.4 /100 | #137 | Excellent 92.9% |
| Immigrants | Brazil | 85.1 /100 | #138 | Excellent 92.9% |
| Crow | 84.1 /100 | #139 | Excellent 92.9% |
| Venezuelans | 83.4 /100 | #140 | Excellent 92.9% |
| Chileans | 83.0 /100 | #141 | Excellent 92.9% |
| Kenyans | 82.0 /100 | #142 | Excellent 92.9% |