Dominican vs Immigrants from Costa Rica Self-Care Disability
COMPARE
Dominican
Immigrants from Costa Rica
Self-Care Disability
Self-Care Disability Comparison
Dominicans
Immigrants from Costa Rica
3.1%
SELF-CARE DISABILITY
0.0/ 100
METRIC RATING
341st/ 347
METRIC RANK
2.4%
SELF-CARE DISABILITY
75.1/ 100
METRIC RATING
150th/ 347
METRIC RANK
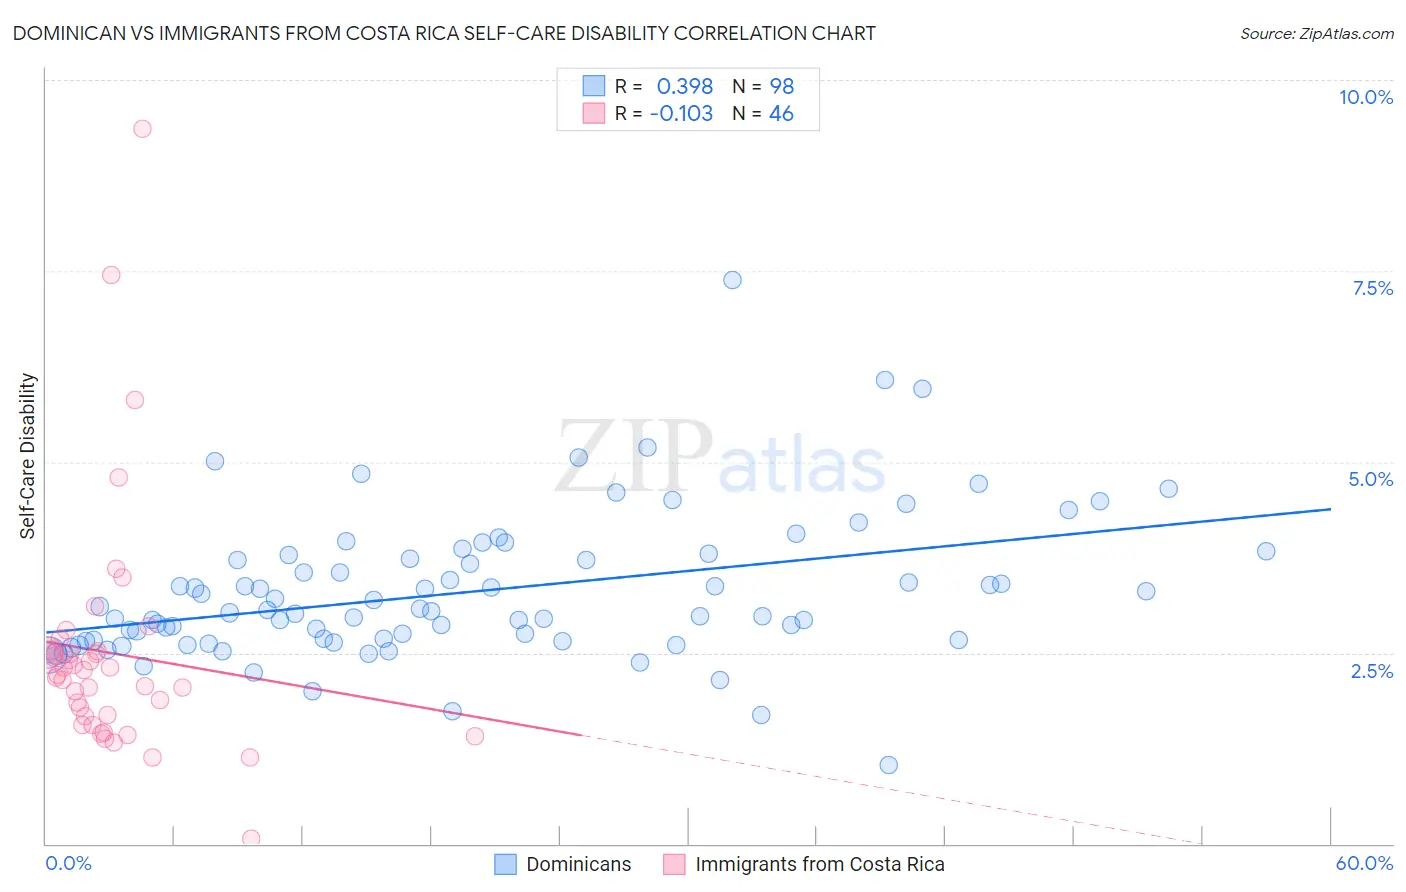
Dominican vs Immigrants from Costa Rica Self-Care Disability Correlation Chart
The statistical analysis conducted on geographies consisting of 354,514,623 people shows a mild positive correlation between the proportion of Dominicans and percentage of population with self-care disability in the United States with a correlation coefficient (R) of 0.398 and weighted average of 3.1%. Similarly, the statistical analysis conducted on geographies consisting of 204,207,185 people shows a poor negative correlation between the proportion of Immigrants from Costa Rica and percentage of population with self-care disability in the United States with a correlation coefficient (R) of -0.103 and weighted average of 2.4%, a difference of 25.9%.
Self-Care Disability Correlation Summary
| Measurement | Dominican | Immigrants from Costa Rica |
| Minimum | 1.0% | 0.069% |
| Maximum | 7.4% | 9.4% |
| Range | 6.3% | 9.3% |
| Mean | 3.3% | 2.5% |
| Median | 3.0% | 2.2% |
| Interquartile 25% (IQ1) | 2.7% | 1.7% |
| Interquartile 75% (IQ3) | 3.7% | 2.5% |
| Interquartile Range (IQR) | 1.1% | 0.85% |
| Standard Deviation (Sample) | 0.96% | 1.6% |
| Standard Deviation (Population) | 0.96% | 1.6% |
Similar Demographics by Self-Care Disability
Demographics Similar to Dominicans by Self-Care Disability
In terms of self-care disability, the demographic groups most similar to Dominicans are Immigrants from Cabo Verde (3.1%, a difference of 0.26%), Immigrants from Dominican Republic (3.0%, a difference of 0.59%), Cape Verdean (3.0%, a difference of 0.98%), Choctaw (3.0%, a difference of 1.3%), and Colville (3.1%, a difference of 1.6%).
| Demographics | Rating | Rank | Self-Care Disability |
| Dutch West Indians | 0.0 /100 | #333 | Tragic 3.0% |
| Houma | 0.0 /100 | #334 | Tragic 3.0% |
| Immigrants | Azores | 0.0 /100 | #335 | Tragic 3.0% |
| Immigrants | Yemen | 0.0 /100 | #336 | Tragic 3.0% |
| Choctaw | 0.0 /100 | #337 | Tragic 3.0% |
| Cape Verdeans | 0.0 /100 | #338 | Tragic 3.0% |
| Immigrants | Dominican Republic | 0.0 /100 | #339 | Tragic 3.0% |
| Immigrants | Cabo Verde | 0.0 /100 | #340 | Tragic 3.1% |
| Dominicans | 0.0 /100 | #341 | Tragic 3.1% |
| Colville | 0.0 /100 | #342 | Tragic 3.1% |
| Tohono O'odham | 0.0 /100 | #343 | Tragic 3.1% |
| Pueblo | 0.0 /100 | #344 | Tragic 3.3% |
| Armenians | 0.0 /100 | #345 | Tragic 3.4% |
| Puerto Ricans | 0.0 /100 | #346 | Tragic 3.7% |
| Immigrants | Armenia | 0.0 /100 | #347 | Tragic 4.2% |
Demographics Similar to Immigrants from Costa Rica by Self-Care Disability
In terms of self-care disability, the demographic groups most similar to Immigrants from Costa Rica are Arab (2.4%, a difference of 0.040%), Romanian (2.4%, a difference of 0.050%), Basque (2.4%, a difference of 0.070%), Tlingit-Haida (2.4%, a difference of 0.10%), and Immigrants from England (2.4%, a difference of 0.10%).
| Demographics | Rating | Rank | Self-Care Disability |
| Afghans | 82.3 /100 | #143 | Excellent 2.4% |
| Costa Ricans | 80.8 /100 | #144 | Excellent 2.4% |
| Germans | 80.1 /100 | #145 | Excellent 2.4% |
| Israelis | 80.0 /100 | #146 | Good 2.4% |
| Dutch | 77.5 /100 | #147 | Good 2.4% |
| Romanians | 75.8 /100 | #148 | Good 2.4% |
| Arabs | 75.7 /100 | #149 | Good 2.4% |
| Immigrants | Costa Rica | 75.1 /100 | #150 | Good 2.4% |
| Basques | 74.0 /100 | #151 | Good 2.4% |
| Tlingit-Haida | 73.5 /100 | #152 | Good 2.4% |
| Immigrants | England | 73.5 /100 | #153 | Good 2.4% |
| Italians | 72.2 /100 | #154 | Good 2.4% |
| Pakistanis | 71.4 /100 | #155 | Good 2.4% |
| Nigerians | 70.6 /100 | #156 | Good 2.4% |
| Immigrants | Europe | 69.6 /100 | #157 | Good 2.4% |