Dominican vs Immigrants from Sri Lanka Self-Care Disability
COMPARE
Dominican
Immigrants from Sri Lanka
Self-Care Disability
Self-Care Disability Comparison
Dominicans
Immigrants from Sri Lanka
3.1%
SELF-CARE DISABILITY
0.0/ 100
METRIC RATING
341st/ 347
METRIC RANK
2.2%
SELF-CARE DISABILITY
99.9/ 100
METRIC RATING
26th/ 347
METRIC RANK
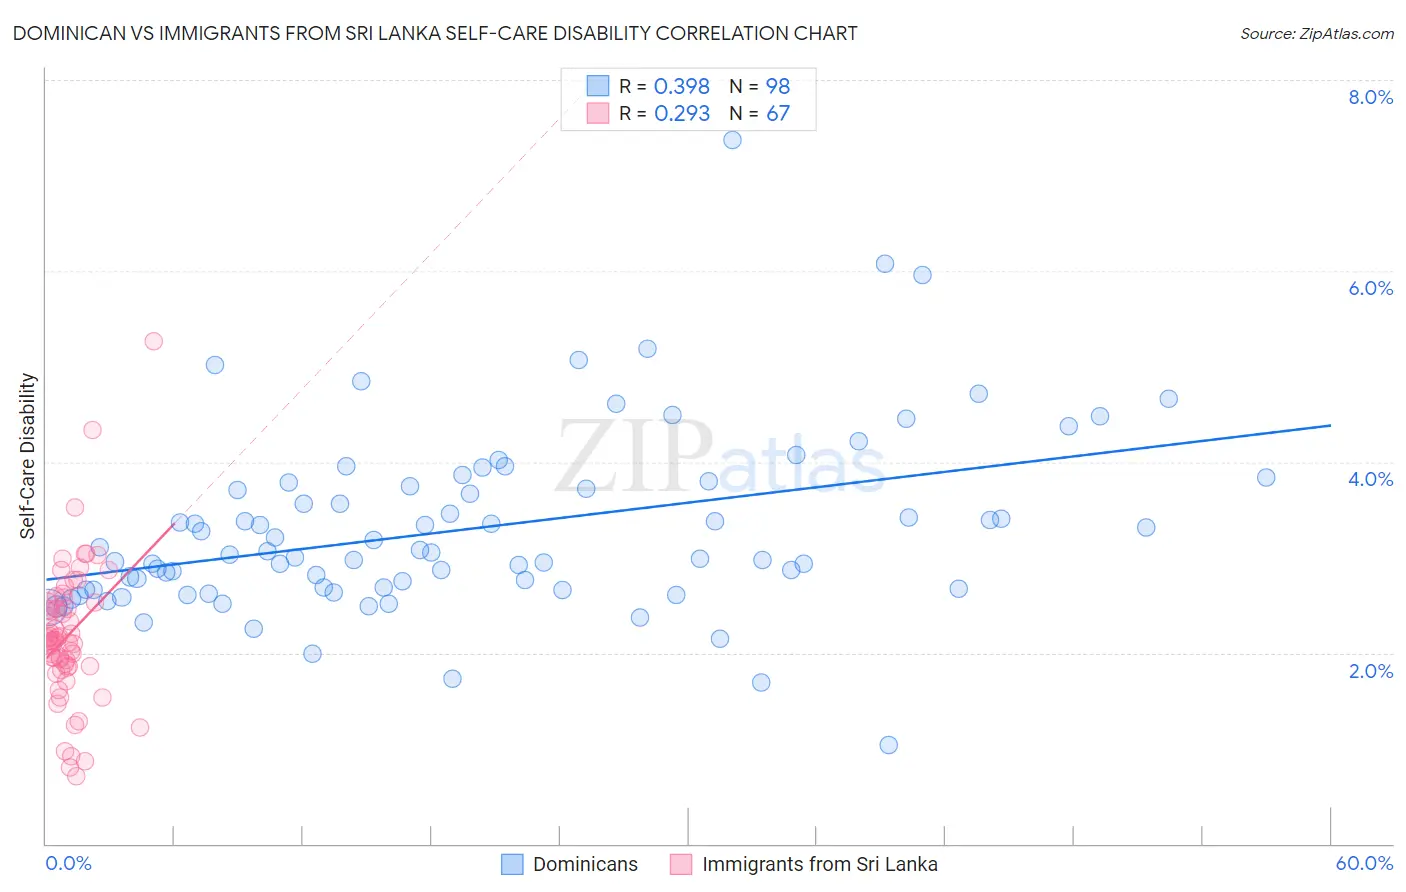
Dominican vs Immigrants from Sri Lanka Self-Care Disability Correlation Chart
The statistical analysis conducted on geographies consisting of 354,514,623 people shows a mild positive correlation between the proportion of Dominicans and percentage of population with self-care disability in the United States with a correlation coefficient (R) of 0.398 and weighted average of 3.1%. Similarly, the statistical analysis conducted on geographies consisting of 149,648,116 people shows a weak positive correlation between the proportion of Immigrants from Sri Lanka and percentage of population with self-care disability in the United States with a correlation coefficient (R) of 0.293 and weighted average of 2.2%, a difference of 36.5%.
Self-Care Disability Correlation Summary
| Measurement | Dominican | Immigrants from Sri Lanka |
| Minimum | 1.0% | 0.71% |
| Maximum | 7.4% | 5.3% |
| Range | 6.3% | 4.6% |
| Mean | 3.3% | 2.2% |
| Median | 3.0% | 2.1% |
| Interquartile 25% (IQ1) | 2.7% | 1.9% |
| Interquartile 75% (IQ3) | 3.7% | 2.5% |
| Interquartile Range (IQR) | 1.1% | 0.68% |
| Standard Deviation (Sample) | 0.96% | 0.75% |
| Standard Deviation (Population) | 0.96% | 0.74% |
Similar Demographics by Self-Care Disability
Demographics Similar to Dominicans by Self-Care Disability
In terms of self-care disability, the demographic groups most similar to Dominicans are Immigrants from Cabo Verde (3.1%, a difference of 0.26%), Immigrants from Dominican Republic (3.0%, a difference of 0.59%), Cape Verdean (3.0%, a difference of 0.98%), Choctaw (3.0%, a difference of 1.3%), and Colville (3.1%, a difference of 1.6%).
| Demographics | Rating | Rank | Self-Care Disability |
| Dutch West Indians | 0.0 /100 | #333 | Tragic 3.0% |
| Houma | 0.0 /100 | #334 | Tragic 3.0% |
| Immigrants | Azores | 0.0 /100 | #335 | Tragic 3.0% |
| Immigrants | Yemen | 0.0 /100 | #336 | Tragic 3.0% |
| Choctaw | 0.0 /100 | #337 | Tragic 3.0% |
| Cape Verdeans | 0.0 /100 | #338 | Tragic 3.0% |
| Immigrants | Dominican Republic | 0.0 /100 | #339 | Tragic 3.0% |
| Immigrants | Cabo Verde | 0.0 /100 | #340 | Tragic 3.1% |
| Dominicans | 0.0 /100 | #341 | Tragic 3.1% |
| Colville | 0.0 /100 | #342 | Tragic 3.1% |
| Tohono O'odham | 0.0 /100 | #343 | Tragic 3.1% |
| Pueblo | 0.0 /100 | #344 | Tragic 3.3% |
| Armenians | 0.0 /100 | #345 | Tragic 3.4% |
| Puerto Ricans | 0.0 /100 | #346 | Tragic 3.7% |
| Immigrants | Armenia | 0.0 /100 | #347 | Tragic 4.2% |
Demographics Similar to Immigrants from Sri Lanka by Self-Care Disability
In terms of self-care disability, the demographic groups most similar to Immigrants from Sri Lanka are Venezuelan (2.2%, a difference of 0.010%), Turkish (2.2%, a difference of 0.070%), Inupiat (2.2%, a difference of 0.17%), Cypriot (2.2%, a difference of 0.18%), and Immigrants from Zimbabwe (2.3%, a difference of 0.26%).
| Demographics | Rating | Rank | Self-Care Disability |
| Immigrants | Eritrea | 100.0 /100 | #19 | Exceptional 2.2% |
| Tongans | 100.0 /100 | #20 | Exceptional 2.2% |
| Bulgarians | 100.0 /100 | #21 | Exceptional 2.2% |
| Immigrants | Venezuela | 100.0 /100 | #22 | Exceptional 2.2% |
| Cambodians | 100.0 /100 | #23 | Exceptional 2.2% |
| Cypriots | 100.0 /100 | #24 | Exceptional 2.2% |
| Turks | 100.0 /100 | #25 | Exceptional 2.2% |
| Immigrants | Sri Lanka | 99.9 /100 | #26 | Exceptional 2.2% |
| Venezuelans | 99.9 /100 | #27 | Exceptional 2.2% |
| Inupiat | 99.9 /100 | #28 | Exceptional 2.2% |
| Immigrants | Zimbabwe | 99.9 /100 | #29 | Exceptional 2.3% |
| Paraguayans | 99.9 /100 | #30 | Exceptional 2.3% |
| Danes | 99.9 /100 | #31 | Exceptional 2.3% |
| Burmese | 99.9 /100 | #32 | Exceptional 2.3% |
| Immigrants | Korea | 99.9 /100 | #33 | Exceptional 2.3% |