Dominican vs Blackfeet Self-Care Disability
COMPARE
Dominican
Blackfeet
Self-Care Disability
Self-Care Disability Comparison
Dominicans
Blackfeet
3.1%
SELF-CARE DISABILITY
0.0/ 100
METRIC RATING
341st/ 347
METRIC RANK
2.7%
SELF-CARE DISABILITY
0.0/ 100
METRIC RATING
294th/ 347
METRIC RANK
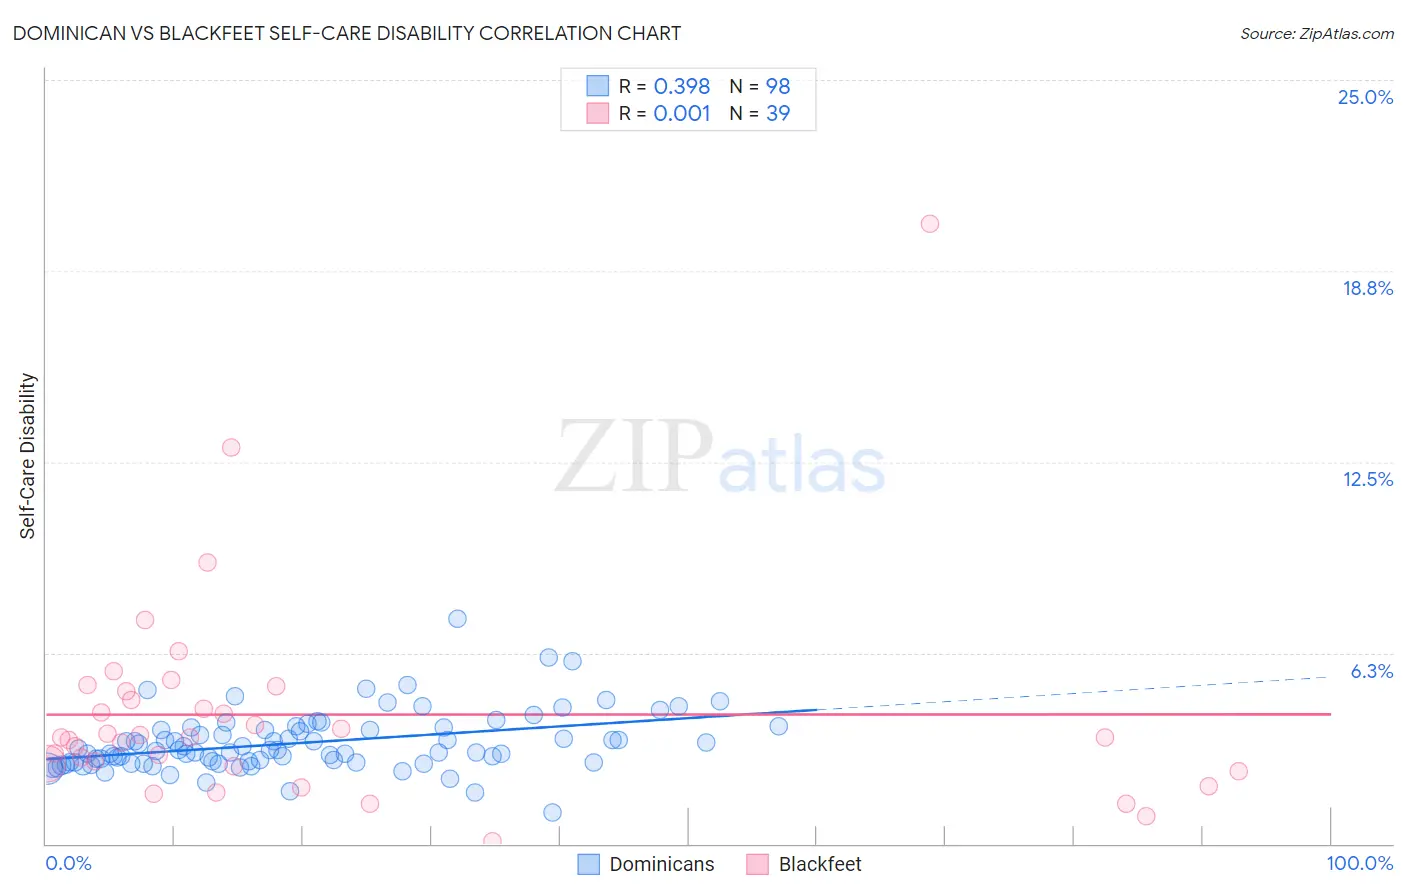
Dominican vs Blackfeet Self-Care Disability Correlation Chart
The statistical analysis conducted on geographies consisting of 354,514,623 people shows a mild positive correlation between the proportion of Dominicans and percentage of population with self-care disability in the United States with a correlation coefficient (R) of 0.398 and weighted average of 3.1%. Similarly, the statistical analysis conducted on geographies consisting of 309,304,153 people shows no correlation between the proportion of Blackfeet and percentage of population with self-care disability in the United States with a correlation coefficient (R) of 0.001 and weighted average of 2.7%, a difference of 11.7%.
Self-Care Disability Correlation Summary
| Measurement | Dominican | Blackfeet |
| Minimum | 1.0% | 0.092% |
| Maximum | 7.4% | 20.3% |
| Range | 6.3% | 20.2% |
| Mean | 3.3% | 4.2% |
| Median | 3.0% | 3.5% |
| Interquartile 25% (IQ1) | 2.7% | 2.5% |
| Interquartile 75% (IQ3) | 3.7% | 5.0% |
| Interquartile Range (IQR) | 1.1% | 2.5% |
| Standard Deviation (Sample) | 0.96% | 3.5% |
| Standard Deviation (Population) | 0.96% | 3.5% |
Similar Demographics by Self-Care Disability
Demographics Similar to Dominicans by Self-Care Disability
In terms of self-care disability, the demographic groups most similar to Dominicans are Immigrants from Cabo Verde (3.1%, a difference of 0.26%), Immigrants from Dominican Republic (3.0%, a difference of 0.59%), Cape Verdean (3.0%, a difference of 0.98%), Choctaw (3.0%, a difference of 1.3%), and Colville (3.1%, a difference of 1.6%).
| Demographics | Rating | Rank | Self-Care Disability |
| Dutch West Indians | 0.0 /100 | #333 | Tragic 3.0% |
| Houma | 0.0 /100 | #334 | Tragic 3.0% |
| Immigrants | Azores | 0.0 /100 | #335 | Tragic 3.0% |
| Immigrants | Yemen | 0.0 /100 | #336 | Tragic 3.0% |
| Choctaw | 0.0 /100 | #337 | Tragic 3.0% |
| Cape Verdeans | 0.0 /100 | #338 | Tragic 3.0% |
| Immigrants | Dominican Republic | 0.0 /100 | #339 | Tragic 3.0% |
| Immigrants | Cabo Verde | 0.0 /100 | #340 | Tragic 3.1% |
| Dominicans | 0.0 /100 | #341 | Tragic 3.1% |
| Colville | 0.0 /100 | #342 | Tragic 3.1% |
| Tohono O'odham | 0.0 /100 | #343 | Tragic 3.1% |
| Pueblo | 0.0 /100 | #344 | Tragic 3.3% |
| Armenians | 0.0 /100 | #345 | Tragic 3.4% |
| Puerto Ricans | 0.0 /100 | #346 | Tragic 3.7% |
| Immigrants | Armenia | 0.0 /100 | #347 | Tragic 4.2% |
Demographics Similar to Blackfeet by Self-Care Disability
In terms of self-care disability, the demographic groups most similar to Blackfeet are Central American Indian (2.7%, a difference of 0.010%), Belizean (2.7%, a difference of 0.010%), Barbadian (2.7%, a difference of 0.14%), Guyanese (2.7%, a difference of 0.16%), and Cuban (2.7%, a difference of 0.43%).
| Demographics | Rating | Rank | Self-Care Disability |
| Immigrants | Jamaica | 0.0 /100 | #287 | Tragic 2.7% |
| Immigrants | Barbados | 0.0 /100 | #288 | Tragic 2.7% |
| Africans | 0.0 /100 | #289 | Tragic 2.7% |
| Cubans | 0.0 /100 | #290 | Tragic 2.7% |
| Guyanese | 0.0 /100 | #291 | Tragic 2.7% |
| Central American Indians | 0.0 /100 | #292 | Tragic 2.7% |
| Belizeans | 0.0 /100 | #293 | Tragic 2.7% |
| Blackfeet | 0.0 /100 | #294 | Tragic 2.7% |
| Barbadians | 0.0 /100 | #295 | Tragic 2.7% |
| Immigrants | Portugal | 0.0 /100 | #296 | Tragic 2.8% |
| West Indians | 0.0 /100 | #297 | Tragic 2.8% |
| Americans | 0.0 /100 | #298 | Tragic 2.8% |
| Immigrants | Guyana | 0.0 /100 | #299 | Tragic 2.8% |
| Immigrants | Fiji | 0.0 /100 | #300 | Tragic 2.8% |
| Pima | 0.0 /100 | #301 | Tragic 2.8% |