Puget Sound Salish vs Immigrants from Costa Rica Self-Care Disability
COMPARE
Puget Sound Salish
Immigrants from Costa Rica
Self-Care Disability
Self-Care Disability Comparison
Puget Sound Salish
Immigrants from Costa Rica
2.8%
SELF-CARE DISABILITY
0.0/ 100
METRIC RATING
311th/ 347
METRIC RANK
2.4%
SELF-CARE DISABILITY
75.1/ 100
METRIC RATING
150th/ 347
METRIC RANK
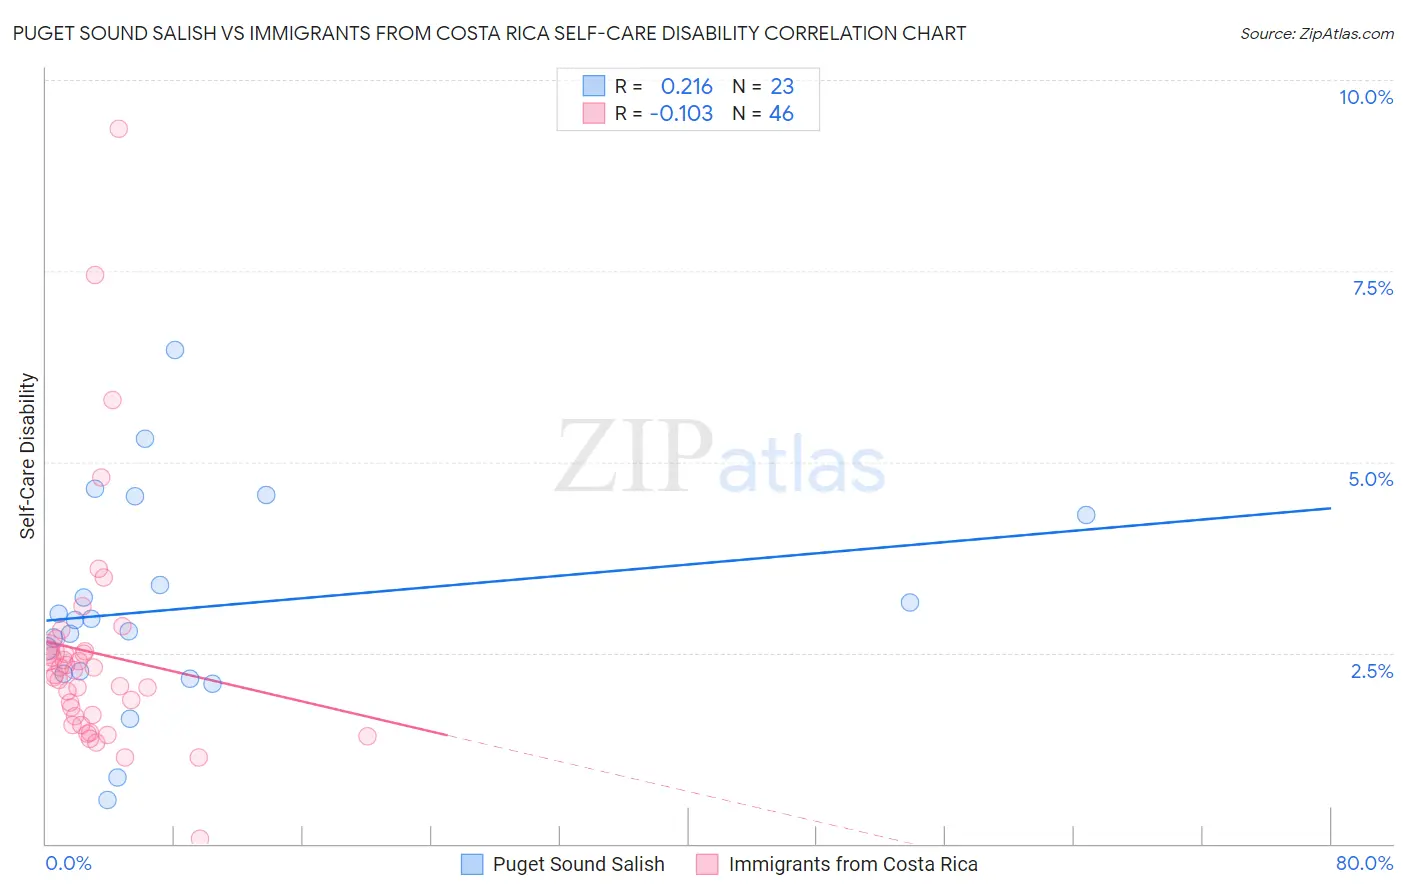
Puget Sound Salish vs Immigrants from Costa Rica Self-Care Disability Correlation Chart
The statistical analysis conducted on geographies consisting of 46,144,161 people shows a weak positive correlation between the proportion of Puget Sound Salish and percentage of population with self-care disability in the United States with a correlation coefficient (R) of 0.216 and weighted average of 2.8%. Similarly, the statistical analysis conducted on geographies consisting of 204,207,185 people shows a poor negative correlation between the proportion of Immigrants from Costa Rica and percentage of population with self-care disability in the United States with a correlation coefficient (R) of -0.103 and weighted average of 2.4%, a difference of 16.0%.
Self-Care Disability Correlation Summary
| Measurement | Puget Sound Salish | Immigrants from Costa Rica |
| Minimum | 0.58% | 0.069% |
| Maximum | 6.5% | 9.4% |
| Range | 5.9% | 9.3% |
| Mean | 3.1% | 2.5% |
| Median | 2.9% | 2.2% |
| Interquartile 25% (IQ1) | 2.2% | 1.7% |
| Interquartile 75% (IQ3) | 4.3% | 2.5% |
| Interquartile Range (IQR) | 2.1% | 0.85% |
| Standard Deviation (Sample) | 1.4% | 1.6% |
| Standard Deviation (Population) | 1.4% | 1.6% |
Similar Demographics by Self-Care Disability
Demographics Similar to Puget Sound Salish by Self-Care Disability
In terms of self-care disability, the demographic groups most similar to Puget Sound Salish are British West Indian (2.8%, a difference of 0.070%), Bangladeshi (2.8%, a difference of 0.17%), Immigrants from Caribbean (2.8%, a difference of 0.19%), Spanish American (2.8%, a difference of 0.23%), and Immigrants from Grenada (2.8%, a difference of 0.32%).
| Demographics | Rating | Rank | Self-Care Disability |
| Cree | 0.0 /100 | #304 | Tragic 2.8% |
| Immigrants | West Indies | 0.0 /100 | #305 | Tragic 2.8% |
| Aleuts | 0.0 /100 | #306 | Tragic 2.8% |
| Natives/Alaskans | 0.0 /100 | #307 | Tragic 2.8% |
| Immigrants | Grenada | 0.0 /100 | #308 | Tragic 2.8% |
| Bangladeshis | 0.0 /100 | #309 | Tragic 2.8% |
| British West Indians | 0.0 /100 | #310 | Tragic 2.8% |
| Puget Sound Salish | 0.0 /100 | #311 | Tragic 2.8% |
| Immigrants | Caribbean | 0.0 /100 | #312 | Tragic 2.8% |
| Spanish Americans | 0.0 /100 | #313 | Tragic 2.8% |
| Creek | 0.0 /100 | #314 | Tragic 2.8% |
| Immigrants | Cuba | 0.0 /100 | #315 | Tragic 2.8% |
| Menominee | 0.0 /100 | #316 | Tragic 2.8% |
| Immigrants | Dominica | 0.0 /100 | #317 | Tragic 2.8% |
| Assyrians/Chaldeans/Syriacs | 0.0 /100 | #318 | Tragic 2.8% |
Demographics Similar to Immigrants from Costa Rica by Self-Care Disability
In terms of self-care disability, the demographic groups most similar to Immigrants from Costa Rica are Arab (2.4%, a difference of 0.040%), Romanian (2.4%, a difference of 0.050%), Basque (2.4%, a difference of 0.070%), Tlingit-Haida (2.4%, a difference of 0.10%), and Immigrants from England (2.4%, a difference of 0.10%).
| Demographics | Rating | Rank | Self-Care Disability |
| Afghans | 82.3 /100 | #143 | Excellent 2.4% |
| Costa Ricans | 80.8 /100 | #144 | Excellent 2.4% |
| Germans | 80.1 /100 | #145 | Excellent 2.4% |
| Israelis | 80.0 /100 | #146 | Good 2.4% |
| Dutch | 77.5 /100 | #147 | Good 2.4% |
| Romanians | 75.8 /100 | #148 | Good 2.4% |
| Arabs | 75.7 /100 | #149 | Good 2.4% |
| Immigrants | Costa Rica | 75.1 /100 | #150 | Good 2.4% |
| Basques | 74.0 /100 | #151 | Good 2.4% |
| Tlingit-Haida | 73.5 /100 | #152 | Good 2.4% |
| Immigrants | England | 73.5 /100 | #153 | Good 2.4% |
| Italians | 72.2 /100 | #154 | Good 2.4% |
| Pakistanis | 71.4 /100 | #155 | Good 2.4% |
| Nigerians | 70.6 /100 | #156 | Good 2.4% |
| Immigrants | Europe | 69.6 /100 | #157 | Good 2.4% |