Hmong vs Choctaw Disability Age Under 5
COMPARE
Hmong
Choctaw
Disability Age Under 5
Disability Age Under 5 Comparison
Hmong
Choctaw
1.1%
DISABILITY AGE UNDER 5
98.0/ 100
METRIC RATING
79th/ 347
METRIC RANK
1.9%
DISABILITY AGE UNDER 5
0.0/ 100
METRIC RATING
330th/ 347
METRIC RANK
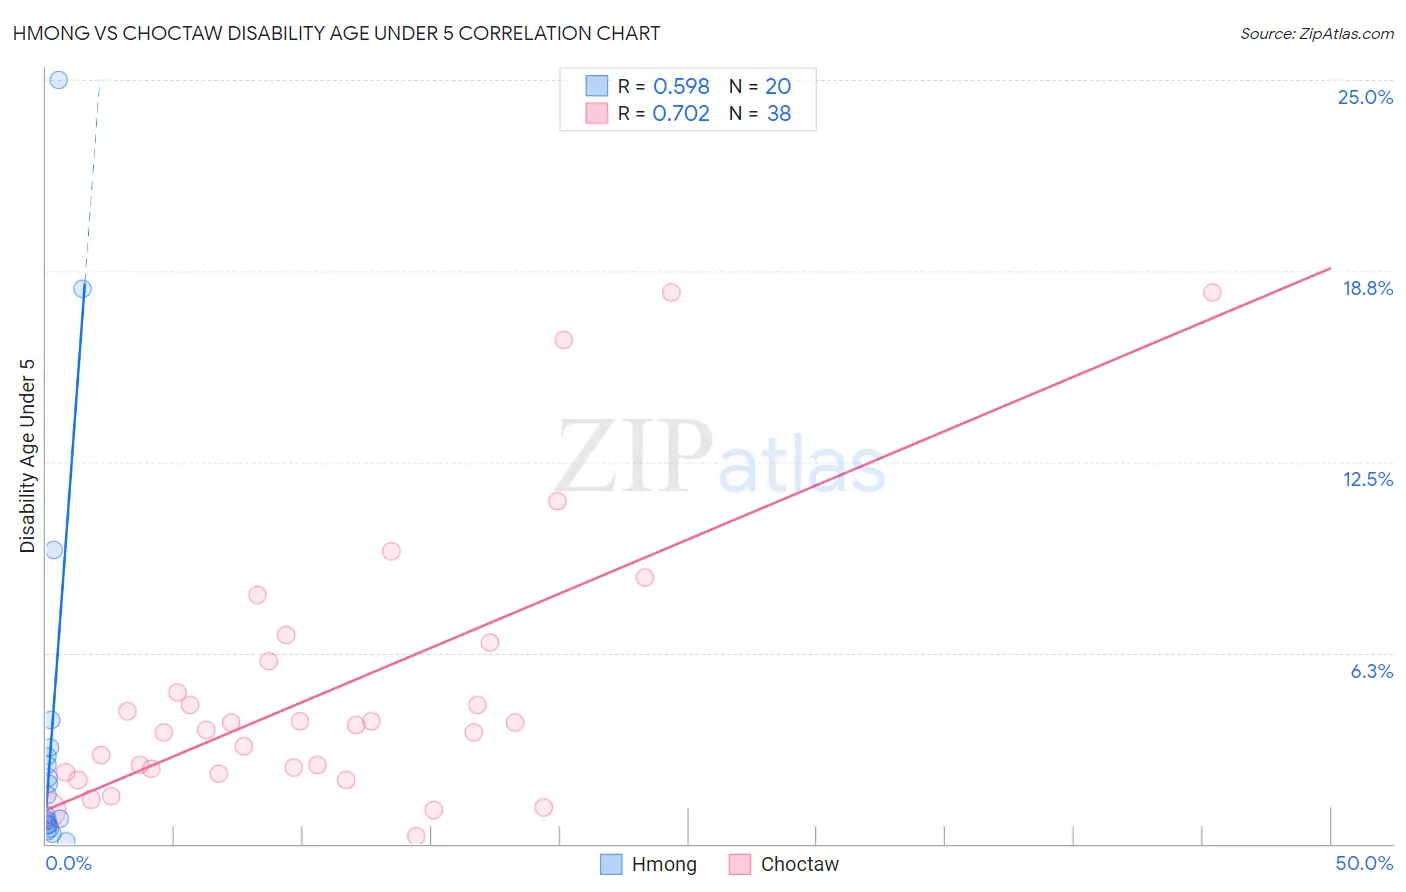
Hmong vs Choctaw Disability Age Under 5 Correlation Chart
The statistical analysis conducted on geographies consisting of 22,687,572 people shows a substantial positive correlation between the proportion of Hmong and percentage of population with a disability under the age of 5 in the United States with a correlation coefficient (R) of 0.598 and weighted average of 1.1%. Similarly, the statistical analysis conducted on geographies consisting of 165,165,816 people shows a strong positive correlation between the proportion of Choctaw and percentage of population with a disability under the age of 5 in the United States with a correlation coefficient (R) of 0.702 and weighted average of 1.9%, a difference of 65.7%.
Disability Age Under 5 Correlation Summary
| Measurement | Hmong | Choctaw |
| Minimum | 0.097% | 0.24% |
| Maximum | 25.0% | 18.0% |
| Range | 24.9% | 17.8% |
| Mean | 3.9% | 5.0% |
| Median | 1.3% | 3.8% |
| Interquartile 25% (IQ1) | 0.61% | 2.3% |
| Interquartile 75% (IQ3) | 3.0% | 6.0% |
| Interquartile Range (IQR) | 2.4% | 3.6% |
| Standard Deviation (Sample) | 6.5% | 4.4% |
| Standard Deviation (Population) | 6.4% | 4.4% |
Similar Demographics by Disability Age Under 5
Demographics Similar to Hmong by Disability Age Under 5
In terms of disability age under 5, the demographic groups most similar to Hmong are West Indian (1.1%, a difference of 0.020%), Immigrants from Trinidad and Tobago (1.1%, a difference of 0.020%), Turkish (1.1%, a difference of 0.040%), Immigrants from Denmark (1.1%, a difference of 0.14%), and Immigrants from Jordan (1.1%, a difference of 0.16%).
| Demographics | Rating | Rank | Disability Age Under 5 |
| Burmese | 98.5 /100 | #72 | Exceptional 1.1% |
| Immigrants | Sri Lanka | 98.5 /100 | #73 | Exceptional 1.1% |
| Jordanians | 98.5 /100 | #74 | Exceptional 1.1% |
| Immigrants | Pakistan | 98.4 /100 | #75 | Exceptional 1.1% |
| Immigrants | Burma/Myanmar | 98.2 /100 | #76 | Exceptional 1.1% |
| Immigrants | Denmark | 98.1 /100 | #77 | Exceptional 1.1% |
| West Indians | 98.0 /100 | #78 | Exceptional 1.1% |
| Hmong | 98.0 /100 | #79 | Exceptional 1.1% |
| Immigrants | Trinidad and Tobago | 98.0 /100 | #80 | Exceptional 1.1% |
| Turks | 98.0 /100 | #81 | Exceptional 1.1% |
| Immigrants | Jordan | 97.9 /100 | #82 | Exceptional 1.1% |
| Immigrants | Syria | 97.9 /100 | #83 | Exceptional 1.1% |
| Immigrants | Zaire | 97.8 /100 | #84 | Exceptional 1.1% |
| Sudanese | 97.7 /100 | #85 | Exceptional 1.1% |
| Okinawans | 97.6 /100 | #86 | Exceptional 1.1% |
Demographics Similar to Choctaw by Disability Age Under 5
In terms of disability age under 5, the demographic groups most similar to Choctaw are French Canadian (1.9%, a difference of 0.30%), Houma (1.9%, a difference of 0.32%), Chippewa (1.9%, a difference of 0.36%), American (1.9%, a difference of 0.80%), and Osage (1.8%, a difference of 2.5%).
| Demographics | Rating | Rank | Disability Age Under 5 |
| Chickasaw | 0.0 /100 | #323 | Tragic 1.7% |
| Cherokee | 0.0 /100 | #324 | Tragic 1.8% |
| Immigrants | Portugal | 0.0 /100 | #325 | Tragic 1.8% |
| Sioux | 0.0 /100 | #326 | Tragic 1.8% |
| Osage | 0.0 /100 | #327 | Tragic 1.8% |
| Americans | 0.0 /100 | #328 | Tragic 1.9% |
| Houma | 0.0 /100 | #329 | Tragic 1.9% |
| Choctaw | 0.0 /100 | #330 | Tragic 1.9% |
| French Canadians | 0.0 /100 | #331 | Tragic 1.9% |
| Chippewa | 0.0 /100 | #332 | Tragic 1.9% |
| Dutch West Indians | 0.0 /100 | #333 | Tragic 1.9% |
| Natives/Alaskans | 0.0 /100 | #334 | Tragic 1.9% |
| Pennsylvania Germans | 0.0 /100 | #335 | Tragic 1.9% |
| Paraguayans | 0.0 /100 | #336 | Tragic 2.0% |
| Apache | 0.0 /100 | #337 | Tragic 2.0% |