Luxembourger vs Choctaw Disability Age Under 5
COMPARE
Luxembourger
Choctaw
Disability Age Under 5
Disability Age Under 5 Comparison
Luxembourgers
Choctaw
1.3%
DISABILITY AGE UNDER 5
6.1/ 100
METRIC RATING
228th/ 347
METRIC RANK
1.9%
DISABILITY AGE UNDER 5
0.0/ 100
METRIC RATING
330th/ 347
METRIC RANK
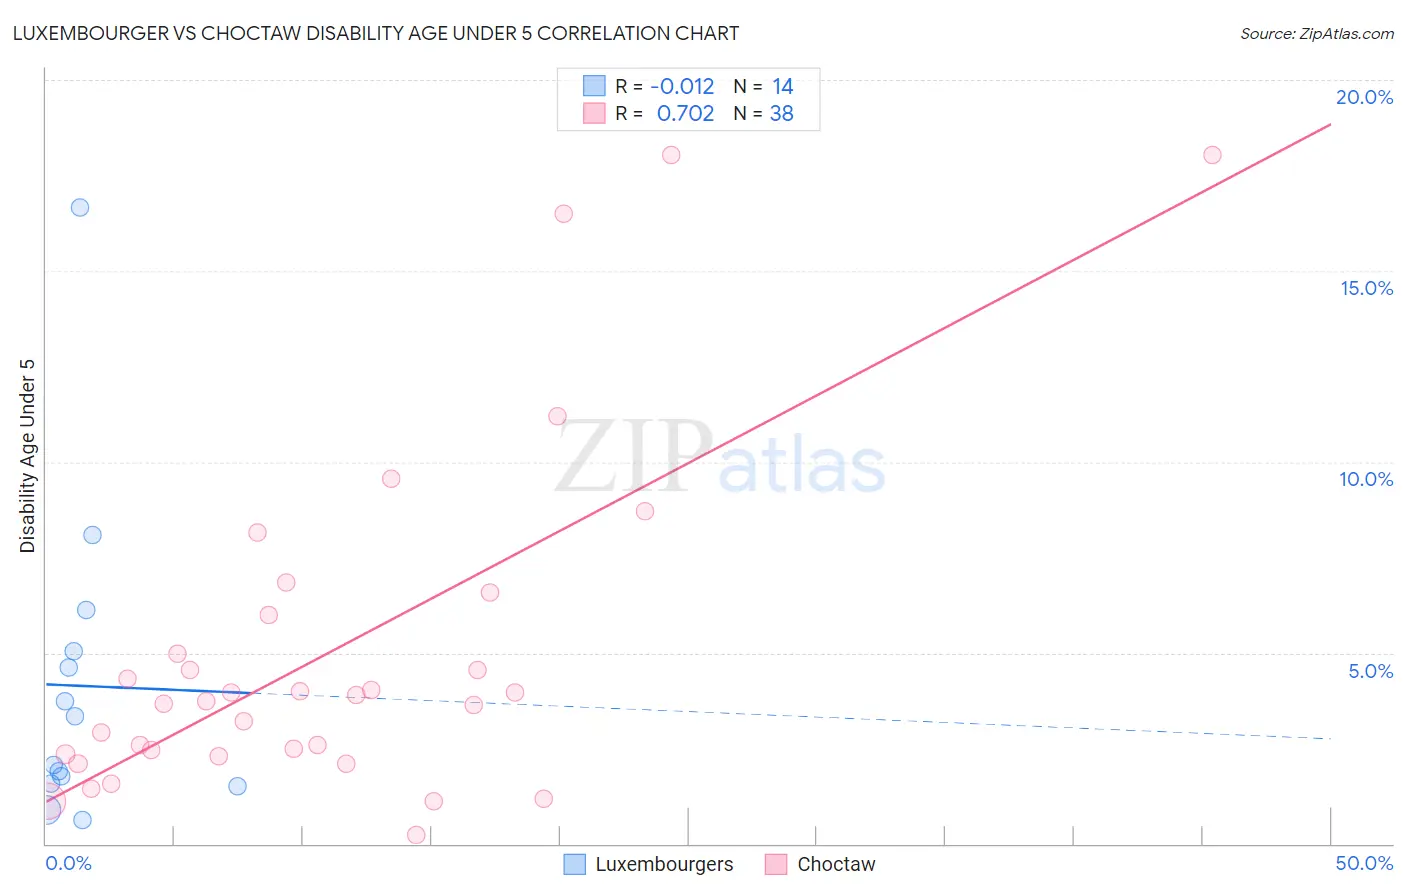
Luxembourger vs Choctaw Disability Age Under 5 Correlation Chart
The statistical analysis conducted on geographies consisting of 100,355,478 people shows no correlation between the proportion of Luxembourgers and percentage of population with a disability under the age of 5 in the United States with a correlation coefficient (R) of -0.012 and weighted average of 1.3%. Similarly, the statistical analysis conducted on geographies consisting of 165,165,816 people shows a strong positive correlation between the proportion of Choctaw and percentage of population with a disability under the age of 5 in the United States with a correlation coefficient (R) of 0.702 and weighted average of 1.9%, a difference of 42.2%.
Disability Age Under 5 Correlation Summary
| Measurement | Luxembourger | Choctaw |
| Minimum | 0.63% | 0.24% |
| Maximum | 16.7% | 18.0% |
| Range | 16.0% | 17.8% |
| Mean | 4.1% | 5.0% |
| Median | 2.7% | 3.8% |
| Interquartile 25% (IQ1) | 1.6% | 2.3% |
| Interquartile 75% (IQ3) | 5.0% | 6.0% |
| Interquartile Range (IQR) | 3.5% | 3.6% |
| Standard Deviation (Sample) | 4.2% | 4.4% |
| Standard Deviation (Population) | 4.0% | 4.4% |
Similar Demographics by Disability Age Under 5
Demographics Similar to Luxembourgers by Disability Age Under 5
In terms of disability age under 5, the demographic groups most similar to Luxembourgers are Taiwanese (1.3%, a difference of 0.010%), Immigrants from Costa Rica (1.3%, a difference of 0.21%), Lebanese (1.3%, a difference of 0.31%), Panamanian (1.3%, a difference of 0.35%), and Bahamian (1.3%, a difference of 0.35%).
| Demographics | Rating | Rank | Disability Age Under 5 |
| Sub-Saharan Africans | 8.3 /100 | #221 | Tragic 1.3% |
| Ukrainians | 8.3 /100 | #222 | Tragic 1.3% |
| Hispanics or Latinos | 7.7 /100 | #223 | Tragic 1.3% |
| Latvians | 7.1 /100 | #224 | Tragic 1.3% |
| Panamanians | 7.1 /100 | #225 | Tragic 1.3% |
| Bahamians | 7.1 /100 | #226 | Tragic 1.3% |
| Taiwanese | 6.1 /100 | #227 | Tragic 1.3% |
| Luxembourgers | 6.1 /100 | #228 | Tragic 1.3% |
| Immigrants | Costa Rica | 5.5 /100 | #229 | Tragic 1.3% |
| Lebanese | 5.3 /100 | #230 | Tragic 1.3% |
| Immigrants | Northern Europe | 4.7 /100 | #231 | Tragic 1.3% |
| French American Indians | 4.5 /100 | #232 | Tragic 1.3% |
| Tongans | 4.2 /100 | #233 | Tragic 1.3% |
| Pueblo | 3.8 /100 | #234 | Tragic 1.3% |
| Central American Indians | 3.6 /100 | #235 | Tragic 1.3% |
Demographics Similar to Choctaw by Disability Age Under 5
In terms of disability age under 5, the demographic groups most similar to Choctaw are French Canadian (1.9%, a difference of 0.30%), Houma (1.9%, a difference of 0.32%), Chippewa (1.9%, a difference of 0.36%), American (1.9%, a difference of 0.80%), and Osage (1.8%, a difference of 2.5%).
| Demographics | Rating | Rank | Disability Age Under 5 |
| Chickasaw | 0.0 /100 | #323 | Tragic 1.7% |
| Cherokee | 0.0 /100 | #324 | Tragic 1.8% |
| Immigrants | Portugal | 0.0 /100 | #325 | Tragic 1.8% |
| Sioux | 0.0 /100 | #326 | Tragic 1.8% |
| Osage | 0.0 /100 | #327 | Tragic 1.8% |
| Americans | 0.0 /100 | #328 | Tragic 1.9% |
| Houma | 0.0 /100 | #329 | Tragic 1.9% |
| Choctaw | 0.0 /100 | #330 | Tragic 1.9% |
| French Canadians | 0.0 /100 | #331 | Tragic 1.9% |
| Chippewa | 0.0 /100 | #332 | Tragic 1.9% |
| Dutch West Indians | 0.0 /100 | #333 | Tragic 1.9% |
| Natives/Alaskans | 0.0 /100 | #334 | Tragic 1.9% |
| Pennsylvania Germans | 0.0 /100 | #335 | Tragic 1.9% |
| Paraguayans | 0.0 /100 | #336 | Tragic 2.0% |
| Apache | 0.0 /100 | #337 | Tragic 2.0% |