Czech vs Immigrants from Eritrea Female Disability
COMPARE
Czech
Immigrants from Eritrea
Female Disability
Female Disability Comparison
Czechs
Immigrants from Eritrea
12.1%
FEMALE DISABILITY
63.6/ 100
METRIC RATING
164th/ 347
METRIC RANK
11.5%
FEMALE DISABILITY
99.7/ 100
METRIC RATING
76th/ 347
METRIC RANK
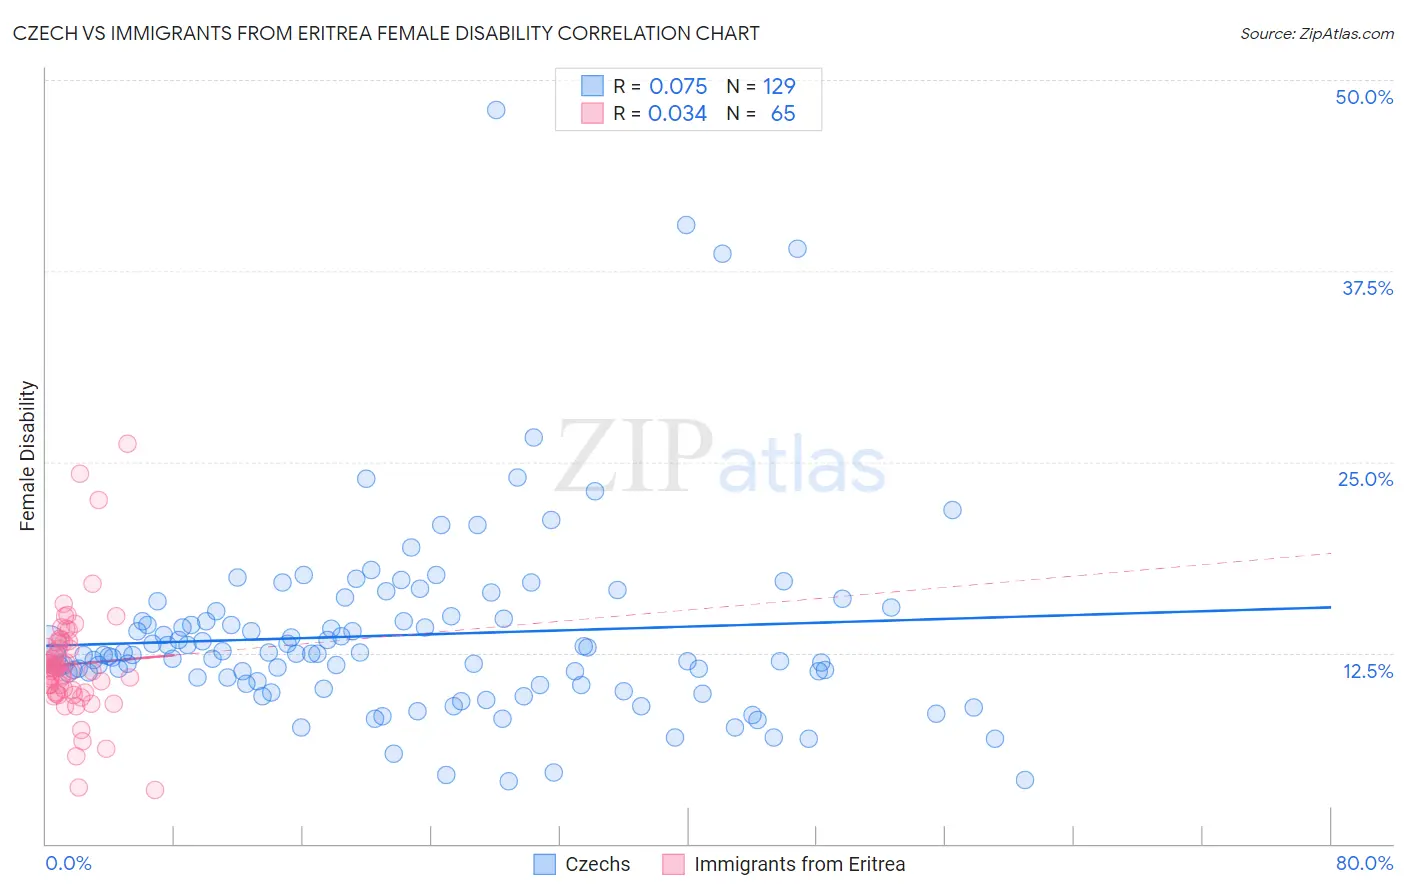
Czech vs Immigrants from Eritrea Female Disability Correlation Chart
The statistical analysis conducted on geographies consisting of 484,697,758 people shows a slight positive correlation between the proportion of Czechs and percentage of females with a disability in the United States with a correlation coefficient (R) of 0.075 and weighted average of 12.1%. Similarly, the statistical analysis conducted on geographies consisting of 104,854,458 people shows no correlation between the proportion of Immigrants from Eritrea and percentage of females with a disability in the United States with a correlation coefficient (R) of 0.034 and weighted average of 11.5%, a difference of 5.3%.
Female Disability Correlation Summary
| Measurement | Czech | Immigrants from Eritrea |
| Minimum | 4.1% | 3.5% |
| Maximum | 48.0% | 26.2% |
| Range | 43.9% | 22.7% |
| Mean | 13.7% | 11.7% |
| Median | 12.5% | 11.5% |
| Interquartile 25% (IQ1) | 10.6% | 9.9% |
| Interquartile 75% (IQ3) | 14.8% | 13.2% |
| Interquartile Range (IQR) | 4.3% | 3.3% |
| Standard Deviation (Sample) | 6.4% | 3.8% |
| Standard Deviation (Population) | 6.4% | 3.7% |
Similar Demographics by Female Disability
Demographics Similar to Czechs by Female Disability
In terms of female disability, the demographic groups most similar to Czechs are Guatemalan (12.1%, a difference of 0.010%), Immigrants from Ukraine (12.1%, a difference of 0.030%), Guyanese (12.1%, a difference of 0.040%), Immigrants from Oceania (12.1%, a difference of 0.070%), and Immigrants from Guatemala (12.1%, a difference of 0.10%).
| Demographics | Rating | Rank | Female Disability |
| Danes | 72.5 /100 | #157 | Good 12.1% |
| Immigrants | Middle Africa | 72.4 /100 | #158 | Good 12.1% |
| Immigrants | Central America | 67.7 /100 | #159 | Good 12.1% |
| Immigrants | Guatemala | 66.0 /100 | #160 | Good 12.1% |
| Guyanese | 64.7 /100 | #161 | Good 12.1% |
| Immigrants | Ukraine | 64.3 /100 | #162 | Good 12.1% |
| Guatemalans | 63.8 /100 | #163 | Good 12.1% |
| Czechs | 63.6 /100 | #164 | Good 12.1% |
| Immigrants | Oceania | 61.8 /100 | #165 | Good 12.1% |
| Lithuanians | 59.5 /100 | #166 | Average 12.2% |
| Immigrants | Latin America | 59.0 /100 | #167 | Average 12.2% |
| Immigrants | Haiti | 58.8 /100 | #168 | Average 12.2% |
| Lebanese | 58.1 /100 | #169 | Average 12.2% |
| Maltese | 57.0 /100 | #170 | Average 12.2% |
| Immigrants | Southern Europe | 56.3 /100 | #171 | Average 12.2% |
Demographics Similar to Immigrants from Eritrea by Female Disability
In terms of female disability, the demographic groups most similar to Immigrants from Eritrea are Immigrants from Afghanistan (11.5%, a difference of 0.0%), Immigrants from South Africa (11.5%, a difference of 0.010%), Immigrants from Lebanon (11.5%, a difference of 0.030%), Sierra Leonean (11.5%, a difference of 0.030%), and Immigrants from Jordan (11.5%, a difference of 0.040%).
| Demographics | Rating | Rank | Female Disability |
| Colombians | 99.8 /100 | #69 | Exceptional 11.5% |
| Immigrants | Chile | 99.8 /100 | #70 | Exceptional 11.5% |
| Immigrants | Ireland | 99.8 /100 | #71 | Exceptional 11.5% |
| Chileans | 99.8 /100 | #72 | Exceptional 11.5% |
| Immigrants | Switzerland | 99.8 /100 | #73 | Exceptional 11.5% |
| Bhutanese | 99.8 /100 | #74 | Exceptional 11.5% |
| Immigrants | Lebanon | 99.7 /100 | #75 | Exceptional 11.5% |
| Immigrants | Eritrea | 99.7 /100 | #76 | Exceptional 11.5% |
| Immigrants | Afghanistan | 99.7 /100 | #77 | Exceptional 11.5% |
| Immigrants | South Africa | 99.7 /100 | #78 | Exceptional 11.5% |
| Sierra Leoneans | 99.7 /100 | #79 | Exceptional 11.5% |
| Immigrants | Jordan | 99.7 /100 | #80 | Exceptional 11.5% |
| Eastern Europeans | 99.7 /100 | #81 | Exceptional 11.5% |
| Luxembourgers | 99.6 /100 | #82 | Exceptional 11.6% |
| Immigrants | Serbia | 99.6 /100 | #83 | Exceptional 11.6% |