Czech vs Immigrants from Korea Female Disability
COMPARE
Czech
Immigrants from Korea
Female Disability
Female Disability Comparison
Czechs
Immigrants from Korea
12.1%
FEMALE DISABILITY
63.6/ 100
METRIC RATING
164th/ 347
METRIC RANK
10.6%
FEMALE DISABILITY
100.0/ 100
METRIC RATING
11th/ 347
METRIC RANK
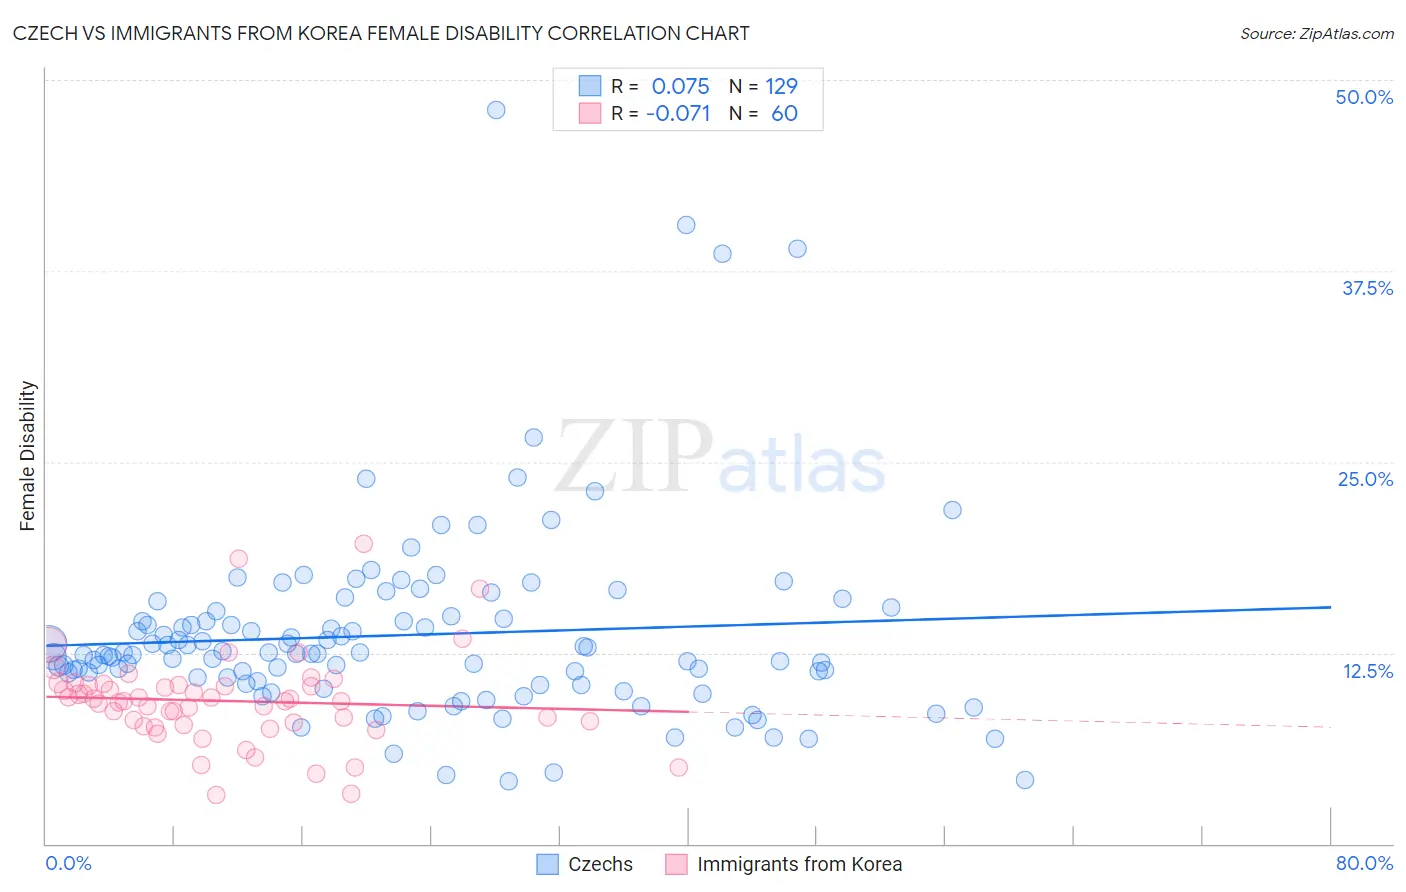
Czech vs Immigrants from Korea Female Disability Correlation Chart
The statistical analysis conducted on geographies consisting of 484,697,758 people shows a slight positive correlation between the proportion of Czechs and percentage of females with a disability in the United States with a correlation coefficient (R) of 0.075 and weighted average of 12.1%. Similarly, the statistical analysis conducted on geographies consisting of 416,288,361 people shows a slight negative correlation between the proportion of Immigrants from Korea and percentage of females with a disability in the United States with a correlation coefficient (R) of -0.071 and weighted average of 10.6%, a difference of 14.0%.
Female Disability Correlation Summary
| Measurement | Czech | Immigrants from Korea |
| Minimum | 4.1% | 3.2% |
| Maximum | 48.0% | 19.6% |
| Range | 43.9% | 16.4% |
| Mean | 13.7% | 9.4% |
| Median | 12.5% | 9.3% |
| Interquartile 25% (IQ1) | 10.6% | 7.8% |
| Interquartile 75% (IQ3) | 14.8% | 10.4% |
| Interquartile Range (IQR) | 4.3% | 2.6% |
| Standard Deviation (Sample) | 6.4% | 3.0% |
| Standard Deviation (Population) | 6.4% | 3.0% |
Similar Demographics by Female Disability
Demographics Similar to Czechs by Female Disability
In terms of female disability, the demographic groups most similar to Czechs are Guatemalan (12.1%, a difference of 0.010%), Immigrants from Ukraine (12.1%, a difference of 0.030%), Guyanese (12.1%, a difference of 0.040%), Immigrants from Oceania (12.1%, a difference of 0.070%), and Immigrants from Guatemala (12.1%, a difference of 0.10%).
| Demographics | Rating | Rank | Female Disability |
| Danes | 72.5 /100 | #157 | Good 12.1% |
| Immigrants | Middle Africa | 72.4 /100 | #158 | Good 12.1% |
| Immigrants | Central America | 67.7 /100 | #159 | Good 12.1% |
| Immigrants | Guatemala | 66.0 /100 | #160 | Good 12.1% |
| Guyanese | 64.7 /100 | #161 | Good 12.1% |
| Immigrants | Ukraine | 64.3 /100 | #162 | Good 12.1% |
| Guatemalans | 63.8 /100 | #163 | Good 12.1% |
| Czechs | 63.6 /100 | #164 | Good 12.1% |
| Immigrants | Oceania | 61.8 /100 | #165 | Good 12.1% |
| Lithuanians | 59.5 /100 | #166 | Average 12.2% |
| Immigrants | Latin America | 59.0 /100 | #167 | Average 12.2% |
| Immigrants | Haiti | 58.8 /100 | #168 | Average 12.2% |
| Lebanese | 58.1 /100 | #169 | Average 12.2% |
| Maltese | 57.0 /100 | #170 | Average 12.2% |
| Immigrants | Southern Europe | 56.3 /100 | #171 | Average 12.2% |
Demographics Similar to Immigrants from Korea by Female Disability
In terms of female disability, the demographic groups most similar to Immigrants from Korea are Immigrants from Hong Kong (10.6%, a difference of 0.17%), Immigrants from Israel (10.7%, a difference of 0.42%), Immigrants from Eastern Asia (10.7%, a difference of 0.49%), Immigrants from China (10.7%, a difference of 0.52%), and Iranian (10.6%, a difference of 0.82%).
| Demographics | Rating | Rank | Female Disability |
| Thais | 100.0 /100 | #4 | Exceptional 10.2% |
| Immigrants | Bolivia | 100.0 /100 | #5 | Exceptional 10.3% |
| Bolivians | 100.0 /100 | #6 | Exceptional 10.4% |
| Immigrants | Singapore | 100.0 /100 | #7 | Exceptional 10.4% |
| Immigrants | South Central Asia | 100.0 /100 | #8 | Exceptional 10.5% |
| Iranians | 100.0 /100 | #9 | Exceptional 10.6% |
| Immigrants | Hong Kong | 100.0 /100 | #10 | Exceptional 10.6% |
| Immigrants | Korea | 100.0 /100 | #11 | Exceptional 10.6% |
| Immigrants | Israel | 100.0 /100 | #12 | Exceptional 10.7% |
| Immigrants | Eastern Asia | 100.0 /100 | #13 | Exceptional 10.7% |
| Immigrants | China | 100.0 /100 | #14 | Exceptional 10.7% |
| Burmese | 100.0 /100 | #15 | Exceptional 10.7% |
| Okinawans | 100.0 /100 | #16 | Exceptional 10.8% |
| Indians (Asian) | 100.0 /100 | #17 | Exceptional 10.8% |
| Immigrants | Iran | 100.0 /100 | #18 | Exceptional 10.8% |