Czechoslovakian vs Immigrants from Cabo Verde Disability Age 5 to 17
COMPARE
Czechoslovakian
Immigrants from Cabo Verde
Disability Age 5 to 17
Disability Age 5 to 17 Comparison
Czechoslovakians
Immigrants from Cabo Verde
5.9%
DISABILITY AGE 5 TO 17
0.7/ 100
METRIC RATING
263rd/ 347
METRIC RANK
7.1%
DISABILITY AGE 5 TO 17
0.0/ 100
METRIC RATING
343rd/ 347
METRIC RANK
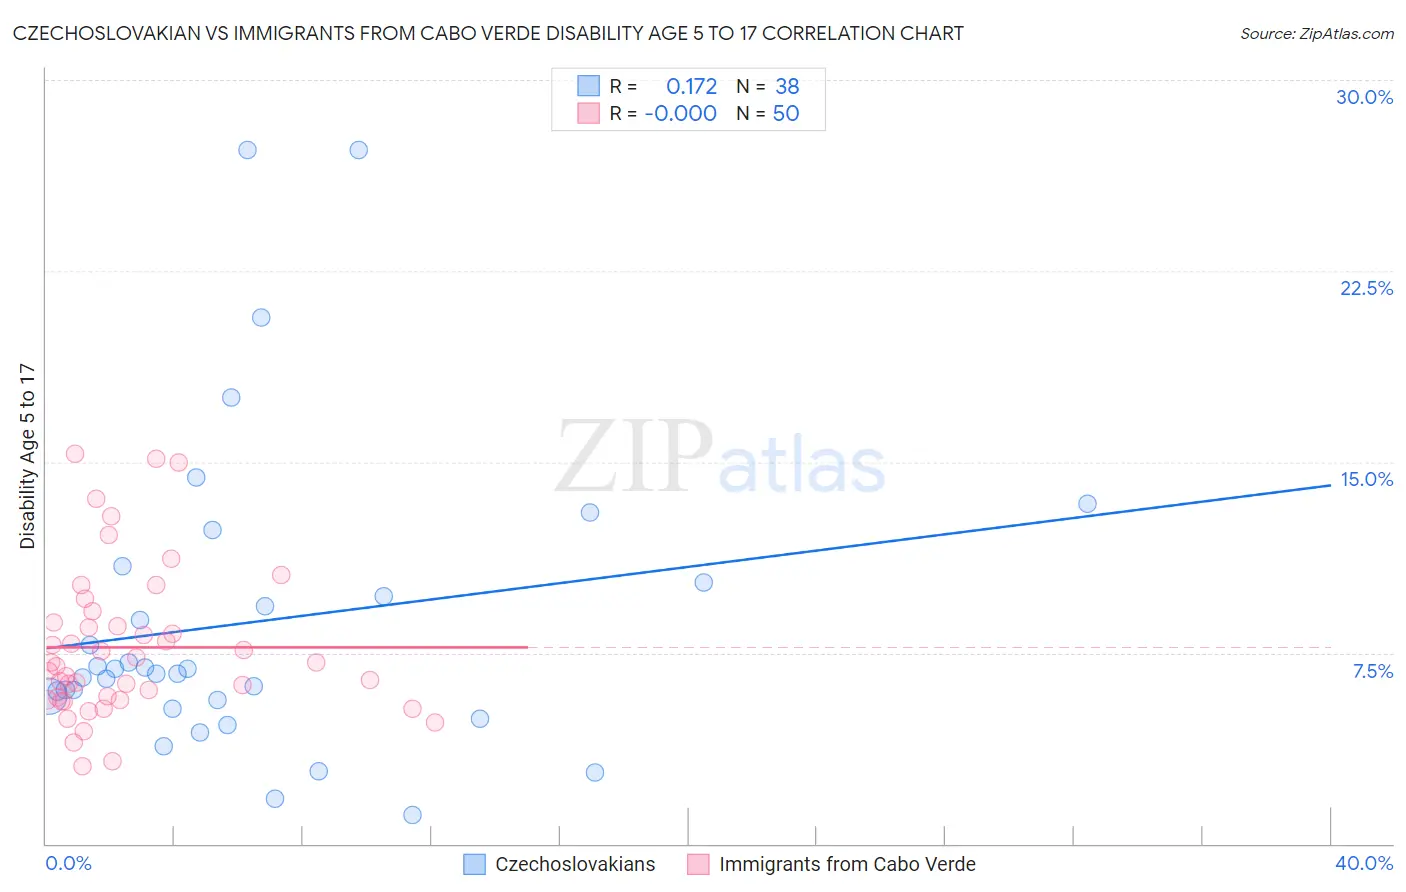
Czechoslovakian vs Immigrants from Cabo Verde Disability Age 5 to 17 Correlation Chart
The statistical analysis conducted on geographies consisting of 365,368,249 people shows a poor positive correlation between the proportion of Czechoslovakians and percentage of population with a disability between the ages 5 and 17 in the United States with a correlation coefficient (R) of 0.172 and weighted average of 5.9%. Similarly, the statistical analysis conducted on geographies consisting of 38,075,511 people shows no correlation between the proportion of Immigrants from Cabo Verde and percentage of population with a disability between the ages 5 and 17 in the United States with a correlation coefficient (R) of -0.000 and weighted average of 7.1%, a difference of 20.0%.
Disability Age 5 to 17 Correlation Summary
| Measurement | Czechoslovakian | Immigrants from Cabo Verde |
| Minimum | 1.1% | 3.1% |
| Maximum | 27.3% | 15.3% |
| Range | 26.2% | 12.3% |
| Mean | 8.7% | 7.7% |
| Median | 6.8% | 7.0% |
| Interquartile 25% (IQ1) | 5.6% | 5.7% |
| Interquartile 75% (IQ3) | 10.3% | 8.7% |
| Interquartile Range (IQR) | 4.7% | 3.0% |
| Standard Deviation (Sample) | 6.0% | 3.0% |
| Standard Deviation (Population) | 5.9% | 2.9% |
Similar Demographics by Disability Age 5 to 17
Demographics Similar to Czechoslovakians by Disability Age 5 to 17
In terms of disability age 5 to 17, the demographic groups most similar to Czechoslovakians are Immigrants from Western Africa (5.9%, a difference of 0.080%), Immigrants from Middle Africa (5.9%, a difference of 0.11%), Canadian (6.0%, a difference of 0.12%), Somali (5.9%, a difference of 0.18%), and Panamanian (6.0%, a difference of 0.19%).
| Demographics | Rating | Rank | Disability Age 5 to 17 |
| Hopi | 1.0 /100 | #256 | Tragic 5.9% |
| Hispanics or Latinos | 1.0 /100 | #257 | Tragic 5.9% |
| Brazilians | 0.9 /100 | #258 | Tragic 5.9% |
| Slavs | 0.9 /100 | #259 | Tragic 5.9% |
| Somalis | 0.8 /100 | #260 | Tragic 5.9% |
| Immigrants | Middle Africa | 0.7 /100 | #261 | Tragic 5.9% |
| Immigrants | Western Africa | 0.7 /100 | #262 | Tragic 5.9% |
| Czechoslovakians | 0.7 /100 | #263 | Tragic 5.9% |
| Canadians | 0.6 /100 | #264 | Tragic 6.0% |
| Panamanians | 0.6 /100 | #265 | Tragic 6.0% |
| Slovenes | 0.6 /100 | #266 | Tragic 6.0% |
| Spanish | 0.5 /100 | #267 | Tragic 6.0% |
| Sioux | 0.4 /100 | #268 | Tragic 6.0% |
| Liberians | 0.4 /100 | #269 | Tragic 6.0% |
| Immigrants | Somalia | 0.4 /100 | #270 | Tragic 6.0% |
Demographics Similar to Immigrants from Cabo Verde by Disability Age 5 to 17
In terms of disability age 5 to 17, the demographic groups most similar to Immigrants from Cabo Verde are Chippewa (7.1%, a difference of 0.26%), Cajun (7.2%, a difference of 0.70%), Cape Verdean (7.0%, a difference of 2.4%), Cherokee (6.9%, a difference of 3.0%), and Choctaw (6.9%, a difference of 3.3%).
| Demographics | Rating | Rank | Disability Age 5 to 17 |
| Blacks/African Americans | 0.0 /100 | #333 | Tragic 6.8% |
| Seminole | 0.0 /100 | #334 | Tragic 6.8% |
| Ottawa | 0.0 /100 | #335 | Tragic 6.8% |
| Chickasaw | 0.0 /100 | #336 | Tragic 6.8% |
| Creek | 0.0 /100 | #337 | Tragic 6.9% |
| Iroquois | 0.0 /100 | #338 | Tragic 6.9% |
| Choctaw | 0.0 /100 | #339 | Tragic 6.9% |
| Cherokee | 0.0 /100 | #340 | Tragic 6.9% |
| Cape Verdeans | 0.0 /100 | #341 | Tragic 7.0% |
| Chippewa | 0.0 /100 | #342 | Tragic 7.1% |
| Immigrants | Cabo Verde | 0.0 /100 | #343 | Tragic 7.1% |
| Cajuns | 0.0 /100 | #344 | Tragic 7.2% |
| Tsimshian | 0.0 /100 | #345 | Tragic 7.9% |
| Puerto Ricans | 0.0 /100 | #346 | Tragic 8.3% |
| Houma | 0.0 /100 | #347 | Tragic 9.1% |