Cypriot vs Immigrants from North Macedonia Disability
COMPARE
Cypriot
Immigrants from North Macedonia
Disability
Disability Comparison
Cypriots
Immigrants from North Macedonia
10.6%
DISABILITY
100.0/ 100
METRIC RATING
27th/ 347
METRIC RANK
11.4%
DISABILITY
93.5/ 100
METRIC RATING
120th/ 347
METRIC RANK
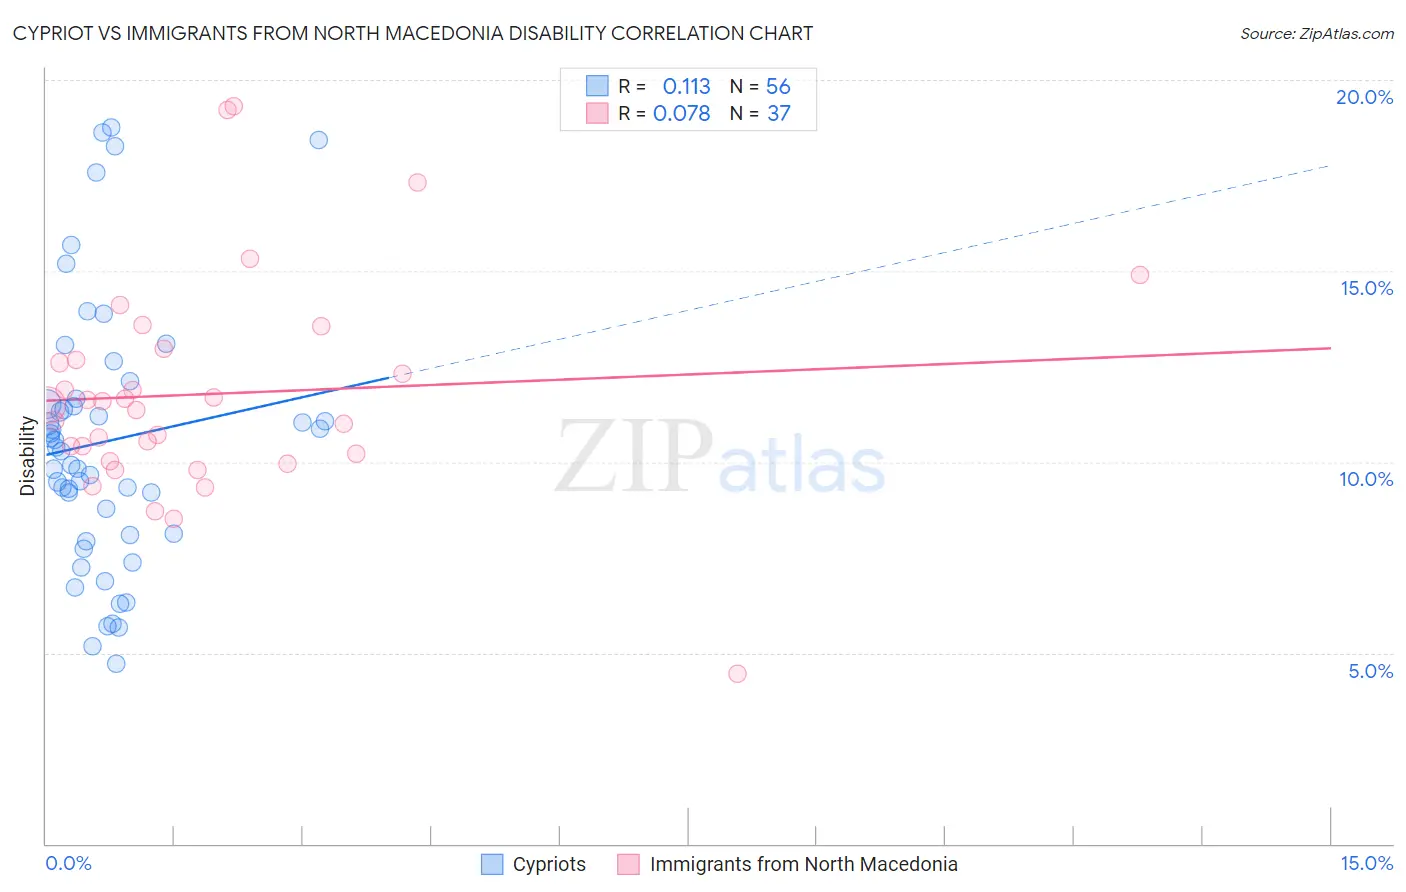
Cypriot vs Immigrants from North Macedonia Disability Correlation Chart
The statistical analysis conducted on geographies consisting of 61,867,698 people shows a poor positive correlation between the proportion of Cypriots and percentage of population with a disability in the United States with a correlation coefficient (R) of 0.113 and weighted average of 10.6%. Similarly, the statistical analysis conducted on geographies consisting of 74,314,151 people shows a slight positive correlation between the proportion of Immigrants from North Macedonia and percentage of population with a disability in the United States with a correlation coefficient (R) of 0.078 and weighted average of 11.4%, a difference of 7.2%.
Disability Correlation Summary
| Measurement | Cypriot | Immigrants from North Macedonia |
| Minimum | 4.7% | 4.5% |
| Maximum | 18.7% | 19.3% |
| Range | 14.0% | 14.8% |
| Mean | 10.5% | 11.8% |
| Median | 10.3% | 11.5% |
| Interquartile 25% (IQ1) | 8.1% | 10.1% |
| Interquartile 75% (IQ3) | 11.6% | 12.8% |
| Interquartile Range (IQR) | 3.5% | 2.7% |
| Standard Deviation (Sample) | 3.5% | 2.8% |
| Standard Deviation (Population) | 3.4% | 2.8% |
Similar Demographics by Disability
Demographics Similar to Cypriots by Disability
In terms of disability, the demographic groups most similar to Cypriots are Argentinean (10.6%, a difference of 0.010%), Immigrants from Malaysia (10.6%, a difference of 0.060%), Egyptian (10.6%, a difference of 0.13%), Immigrants from Argentina (10.6%, a difference of 0.26%), and Immigrants from Turkey (10.6%, a difference of 0.41%).
| Demographics | Rating | Rank | Disability |
| Immigrants | Venezuela | 100.0 /100 | #20 | Exceptional 10.4% |
| Asians | 100.0 /100 | #21 | Exceptional 10.4% |
| Immigrants | Sri Lanka | 100.0 /100 | #22 | Exceptional 10.5% |
| Immigrants | Asia | 100.0 /100 | #23 | Exceptional 10.5% |
| Venezuelans | 100.0 /100 | #24 | Exceptional 10.5% |
| Immigrants | Malaysia | 100.0 /100 | #25 | Exceptional 10.6% |
| Argentineans | 100.0 /100 | #26 | Exceptional 10.6% |
| Cypriots | 100.0 /100 | #27 | Exceptional 10.6% |
| Egyptians | 100.0 /100 | #28 | Exceptional 10.6% |
| Immigrants | Argentina | 100.0 /100 | #29 | Exceptional 10.6% |
| Immigrants | Turkey | 100.0 /100 | #30 | Exceptional 10.6% |
| Immigrants | Egypt | 100.0 /100 | #31 | Exceptional 10.6% |
| Paraguayans | 100.0 /100 | #32 | Exceptional 10.6% |
| Immigrants | Kuwait | 100.0 /100 | #33 | Exceptional 10.7% |
| Immigrants | Ethiopia | 100.0 /100 | #34 | Exceptional 10.7% |
Demographics Similar to Immigrants from North Macedonia by Disability
In terms of disability, the demographic groups most similar to Immigrants from North Macedonia are Central American (11.4%, a difference of 0.0%), Immigrants from Costa Rica (11.4%, a difference of 0.010%), Brazilian (11.4%, a difference of 0.030%), Korean (11.3%, a difference of 0.060%), and Luxembourger (11.3%, a difference of 0.070%).
| Demographics | Rating | Rank | Disability |
| Guyanese | 94.7 /100 | #113 | Exceptional 11.3% |
| Immigrants | Syria | 94.7 /100 | #114 | Exceptional 11.3% |
| Immigrants | Philippines | 94.6 /100 | #115 | Exceptional 11.3% |
| Immigrants | Northern Europe | 94.1 /100 | #116 | Exceptional 11.3% |
| Luxembourgers | 93.9 /100 | #117 | Exceptional 11.3% |
| Koreans | 93.8 /100 | #118 | Exceptional 11.3% |
| Central Americans | 93.5 /100 | #119 | Exceptional 11.4% |
| Immigrants | North Macedonia | 93.5 /100 | #120 | Exceptional 11.4% |
| Immigrants | Costa Rica | 93.4 /100 | #121 | Exceptional 11.4% |
| Brazilians | 93.3 /100 | #122 | Exceptional 11.4% |
| South Africans | 92.3 /100 | #123 | Exceptional 11.4% |
| South American Indians | 92.2 /100 | #124 | Exceptional 11.4% |
| Costa Ricans | 91.9 /100 | #125 | Exceptional 11.4% |
| Immigrants | Latvia | 90.9 /100 | #126 | Exceptional 11.4% |
| Immigrants | Italy | 90.4 /100 | #127 | Exceptional 11.4% |